CIE A Level Chemistry復(fù)習(xí)筆記1.7.12 pH Titration Curves

pH Titration Curves
What are pH titration curves
- Titration is a technique used in neutralisation reactions between acids and alkalis to determine the concentration of the unknown solution
- It involves adding?a titrant?of known concentration from a burette into a conical flask containing the?analyte?of unknown concentration
- An indicator is added which will change colour at the?endpoint?of the titration
- The endpoint is the point at which equal number of moles of?titrant?and?analyte?react with each other
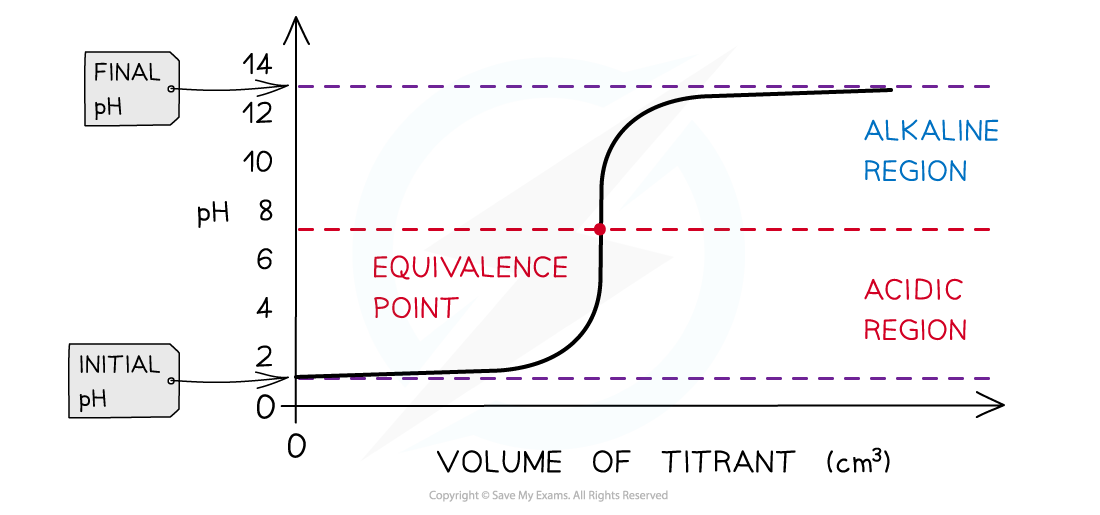
- The equivalence point is halfway the?vertical region?of the curve
Equivalence point → moles of alkali = moles of acid
- This is also known as the?equivalence point?and this is the point at which?neutralisation?takes place
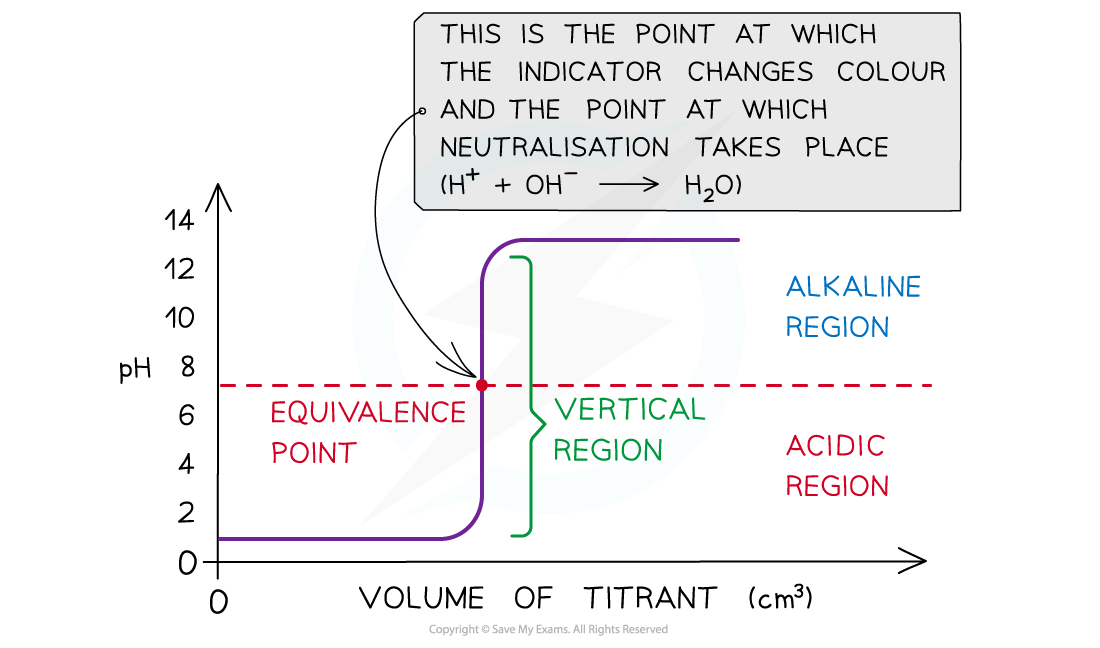
The diagram shows a pH titration curve where the equivalence point is the point at which equal number of moles of titrant and analyte have reacted
Sketching pH titration curve
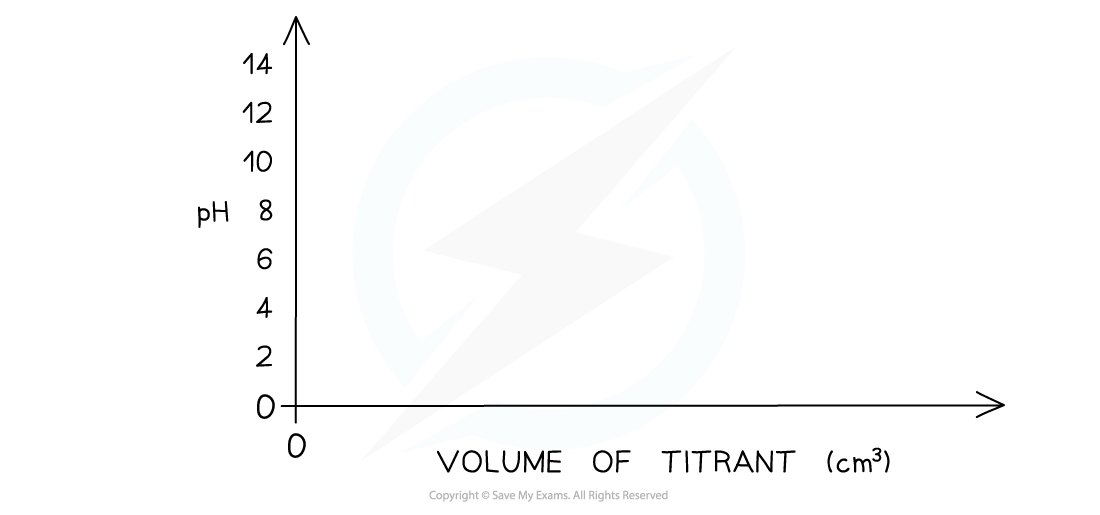
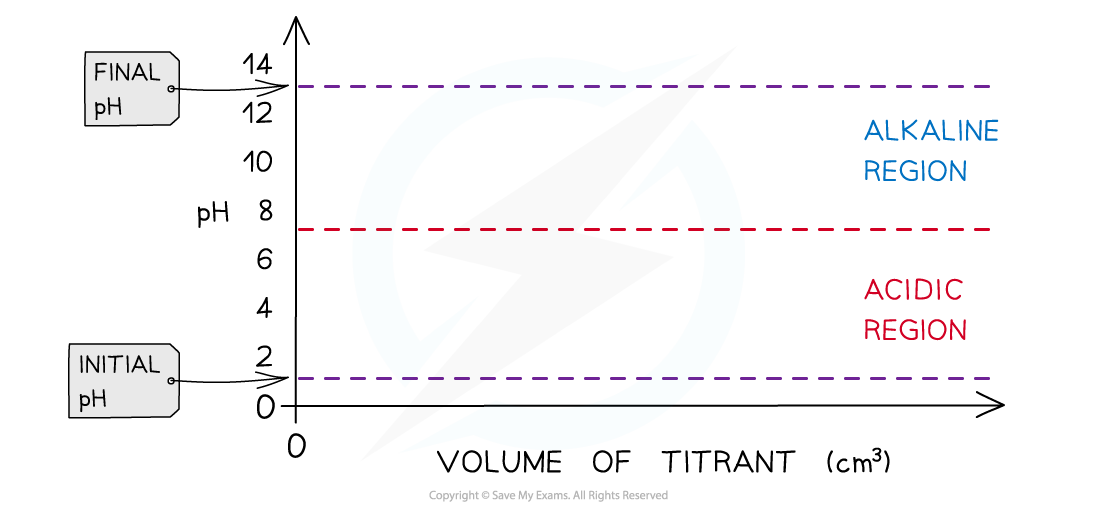
- Draw axes with volume added (cm3) on the x-axis and pH on the y-axis
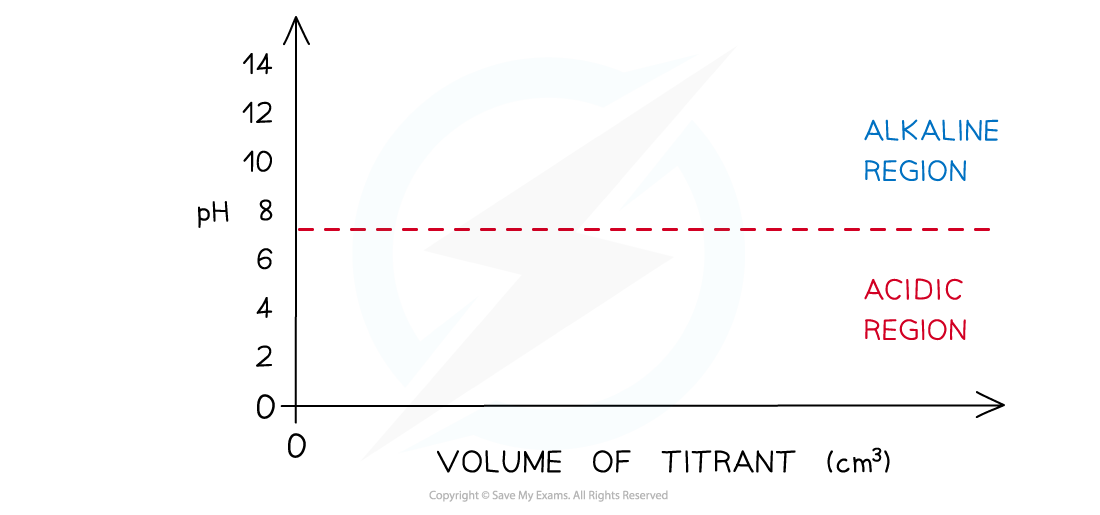
- Draw a horizontal line running parallel to the x-axis at pH 7
- Everything below this line will be in the acidic?region?and everything above it in the?alkaline?region
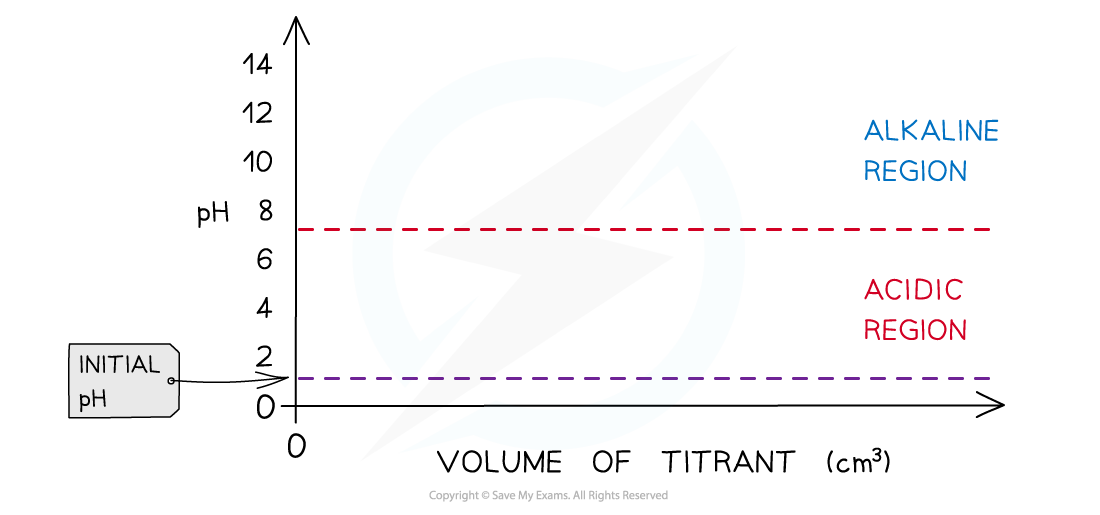
- Determine which substance is in the conical flask
- If it is?a strong acid?the initial pH is about 1 or 2
- If it is?a weak acid the initial pH is about 2-3
- If it is?a strong alkali?the initial pH is about 13-14
- If it is?a weak alkali?the initial pH is about 11
- Determine what type of acids and alkali are used
- Strong acid + strong alkali
- Strong acid + weak alkali
- Weak acid + strong alkali
- Weak acid + weak alkali
- Draw the pH titration curve
Strong acid + strong alkali pH titration curve
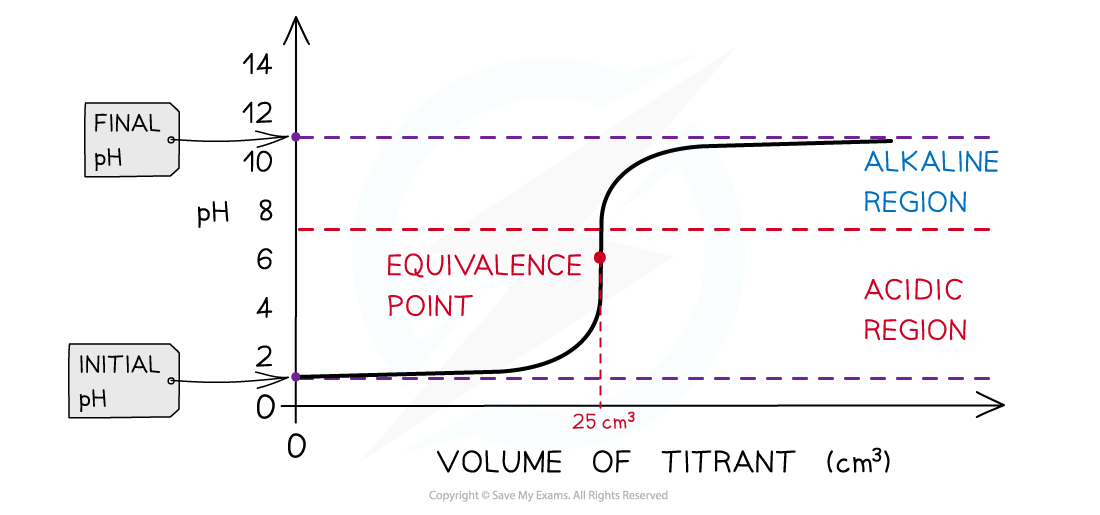
- Initially there are only H+?ions present in solution from the dissociation of the strong acid (HCl) (initial pH about 1-2)
- As the?volume of strong alkali (NaOH) added increases, the pH of the HCl solution slightly increases too as more and more H+?ions react with the OH-?from the NaOH to form water
- The change in pH is not that much until the volume added gets close to the equivalence point
- The pH surges upwards very steeply
- The?equivalence point?is the point at which all H+?ions have been neutralised (therefore pH is 7 at equivalence point)
- Adding more NaOH will increase the pH as now there is an?excess in OH-?ions?(final pH about 13-14)
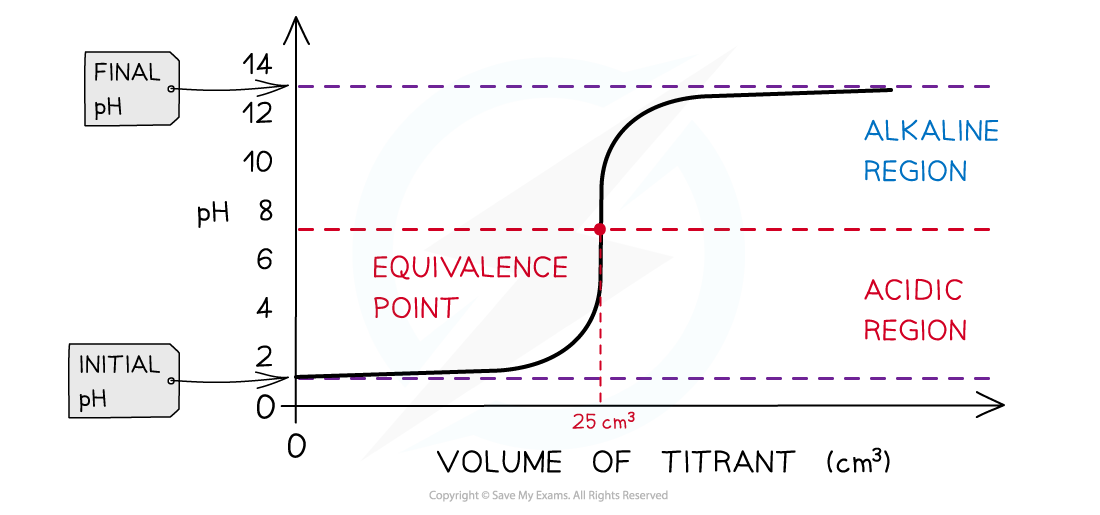
The diagram shows a pH titration curve of 1.0 mol dm-3?HCl (25 cm3) with NaOH
- The pH titration curve for HCl added to a NaOH has the?same shape
- The initial pH and final pH are the other way around
- The equivalence point is still 7
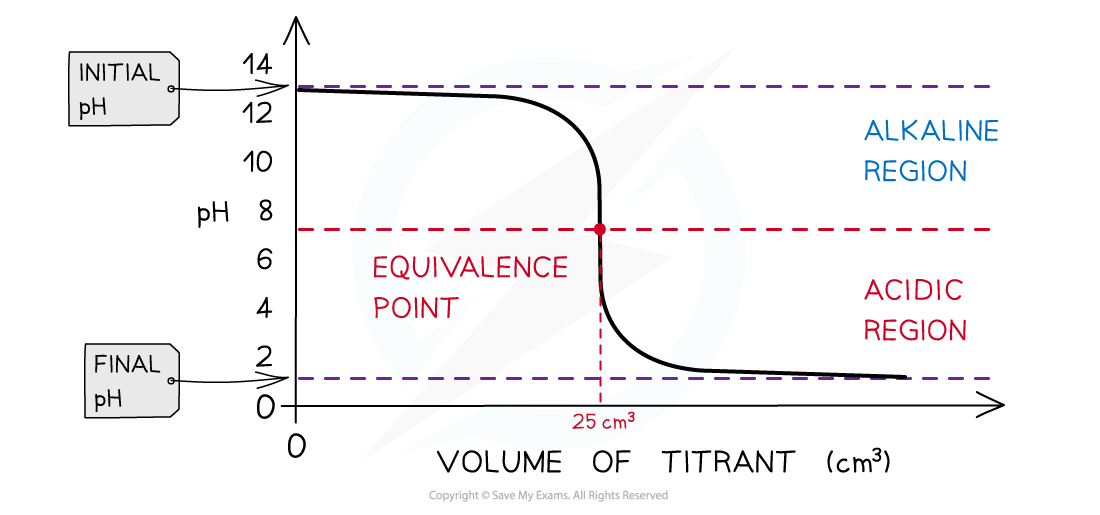
The diagram shows a pH titration curve of 1.0 mol dm-3?NaOH (25 cm3) with HCl
Strong acid + weak alkali pH titration curve
- Initially, there are?only H+?ions present?in solution from the dissociation of the strong acid (HCl) (initial pH about 1-2)
- As the volume of weak alkali (NH3) added increases, the?pH of the analyte solution slightly increases too?as more and more H+?ions react with the NH3
- The change in pH is not that much until the volume added gets close to the equivalence point
- The?equivalence point is the point at which all H+?ions have been neutralised by the NH3?however the equivalence point is not neutral, but the solution is still acidic (pH about 5.5)
- This is because all H+?have reacted with NH3?to form NH4+?which is a relatively strong acid, causing the solution to be acidic
- As more of the NH3?is added, the pH increases to above 7 but below that of a strong alkali as NH3?is a weak alkali
The diagram shows a pH titration curve of 1.0 mol dm-3?HCl (25 cm3) with NH3
- The pH titration curve for strong acid added to a weak alkali has the same shape
- The initial and final pH are the other way around
- The?equivalence point is still about 5.5
Weak acid + strong alkali pH titration curve
- Initially there are?only H+?ions present in solution?from the dissociation of the weak acid (CH3COOH, ethanoic acid) (initial pH about 2-3)
- As the volume of strong alkali (NaOH) added increases, the?pH of the ethanoic acid solution slightly increases too?as more and more H+?ions react with the OH-?from the NaOH to form water
- The change in pH is not that much until the volume added gets close to the equivalence point
- The pH surges upwards very steeply
- The?equivalence point is the point at which all H+?ions have been neutralised by the OH-?ions?however the equivalence points is not neutral, but the solution is slightly basic (pH about 9)
- This is because all H+?in CH3COOH have reacted with OH-?however, CH3COO-?is a relatively strong base, causing the solution to be basic
- As more of the NaOH is added, the pH increases to about 13-14
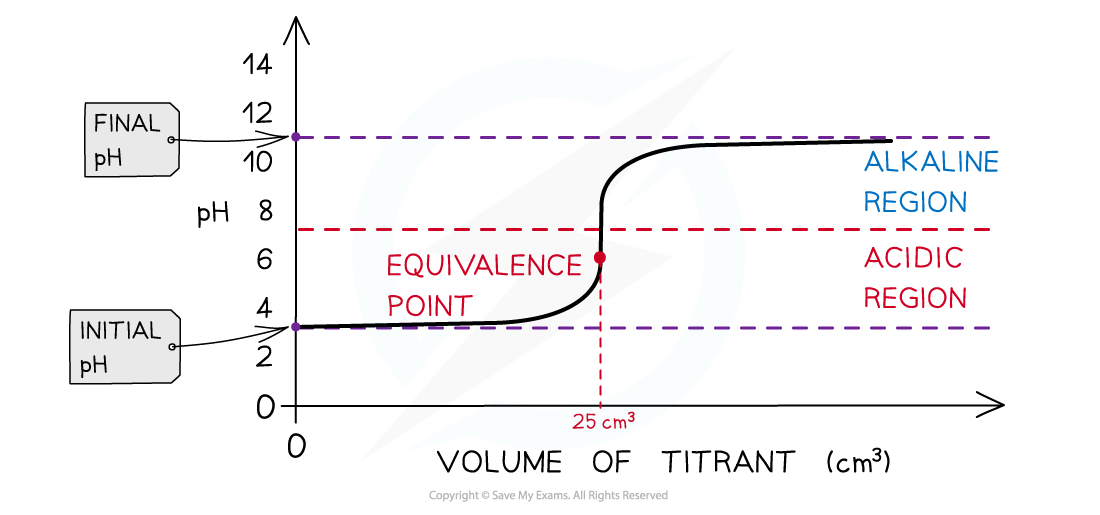
The diagram shows a pH titration curve of a weak acid with a strong base
- The pH titration curve for weak acid added to a strong alkali has the same shape
- The initial and final pH are the other way around
- The?equivalence point is still about 9
Weak acid + weak alkali pH titration curve
- Initially there are only H+?ions present in solution from the dissociation of the weak acid (CH3COOH, ethanoic acid) (initial pH about 2-3)
- In these pH titration curves, there is no vertical region
- There is a?‘point of inflexion’?at the equivalence point
- The curve does not provide much other information
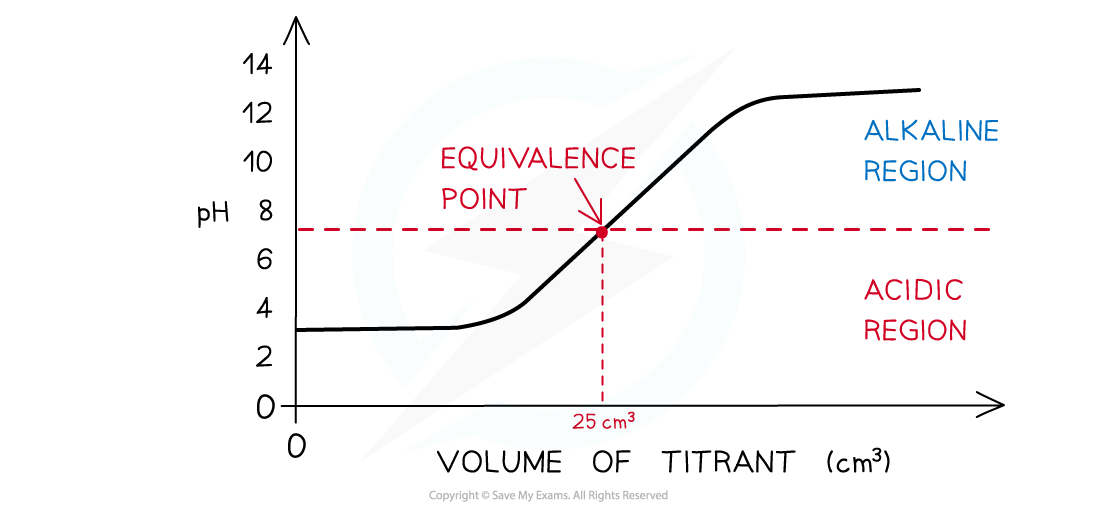
The diagram shows a pH titration curve of 1.0 mol dm-3?weak acid (25 cm3) with weak alkali
Exam Tip
You should be able to read and sketch pH titration curves of titrations where the titrant is an acid or an alkali.
轉(zhuǎn)載自savemyexams
以上就是關(guān)于【CIE A Level Chemistry復(fù)習(xí)筆記1.7.12 pH Titration Curves】的解答,如需了解學(xué)校/賽事/課程動態(tài),可至翰林教育官網(wǎng)獲取更多信息。
往期文章閱讀推薦:
MIT官方發(fā)布【2026年夏季推薦閱讀書單】!橫跨科學(xué)/人文/經(jīng)濟(jì)...
全網(wǎng)破防!ALevel CIE數(shù)學(xué)M1疑似錯題?經(jīng)濟(jì)P2難度飆升?5月6日大考考情分析必看!


翰林AMC8視頻課重磅上線!

國際競賽真題資源免費領(lǐng)取


