Edexcel A Level Economics A:復習筆記3.4.2 Perfect Competition

Characteristics of Perfect Competition
- The characteristics of?perfect competition?are as follows
- There are many buyers and sellers:?due to the number of market participants sellers are?price takers
- There are no?barriers to entry?& exit from the industry:?firms can start-up or leave the industry with relative ease which increases the level of competition
- Buyers & sellers possess perfect knowledge of prices:?this assumption presupposes perfect information e.g if one seller lowers their price then all buyers will know about it
- The products are?homogenous: this means firms are unable to build brand loyalty as perfect substitutes exist & any price changes will result in losing customers
Profit Maximising Equilibrium in the Short & Long-run
- In order to?maximise profit, firms in perfect competition produce up to the level of output where?marginal cost?=?marginal revenue (MC=MR)
- The firm does not have any?market power?so it is unable to influence the price & quantity
- The firm is a?price taker?due to the large number of sellers
- The firm's?selling price?is the same as the market price,?P1?= MR = AR = Demand
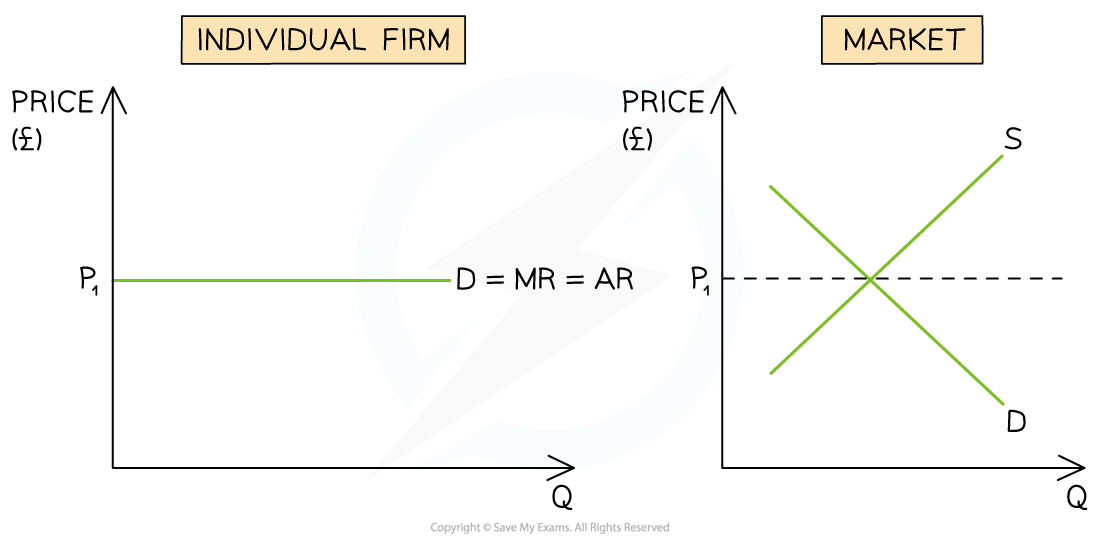
A diagram that illustrates how an individual firm in perfect competition has to accept the market/industry price (P1)
- In the?short-run, firms can make?supernormal profit or losses?in perfect competition
- However, they will always return to the long-run equilibrium where they make?normal profit
Perfect Competition Diagrams
Short-run Profit Maximisation
- Firms in?perfect competition?are able to make?supernormal profit in the?short-run
- The MC curve is the?supply curve?of the firm
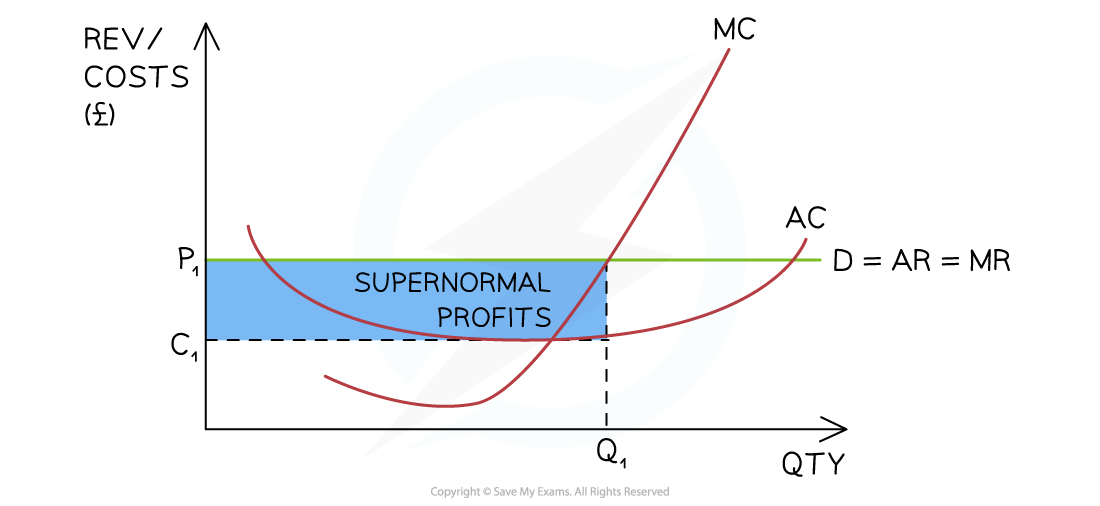
A diagram illustrating a perfectly competitive firm making supernormal profit in the short-run as the AR > AC at the profit maximisation level of output (Q1)
Diagram Analysis
- The firms is producing at the?profit maximisation level of output?where?MC=MR (Q1)
- At this point the AR (P1) > AC (C1)
- The firm is making supernormal profit
Short-run Losses
- Firms in?perfect competition?are able to make?losses?in the?short-run

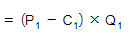
A diagram illustrating a perfectly competitive firm making losses in the short-run as the AR < AC at the profit maximisation level of output (Q1)
Diagram Analysis
- The firms are producing at the?profit maximisation level of output?where?MC=MR (Q1)
- At this level of output, the?AR (P1) < AC (C1)
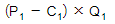
- The firm's loss is equivalent to
Moving From Short-run Profits to the Long-run Equilibrium
- If firms in?perfect competition?make?supernormal profit?in the?short-run,?new entrants are attracted to the industry
- They are?incentivised?by the opportunity to make supernormal profit
- There are no?barriers to entry
- It is easy to join the industry
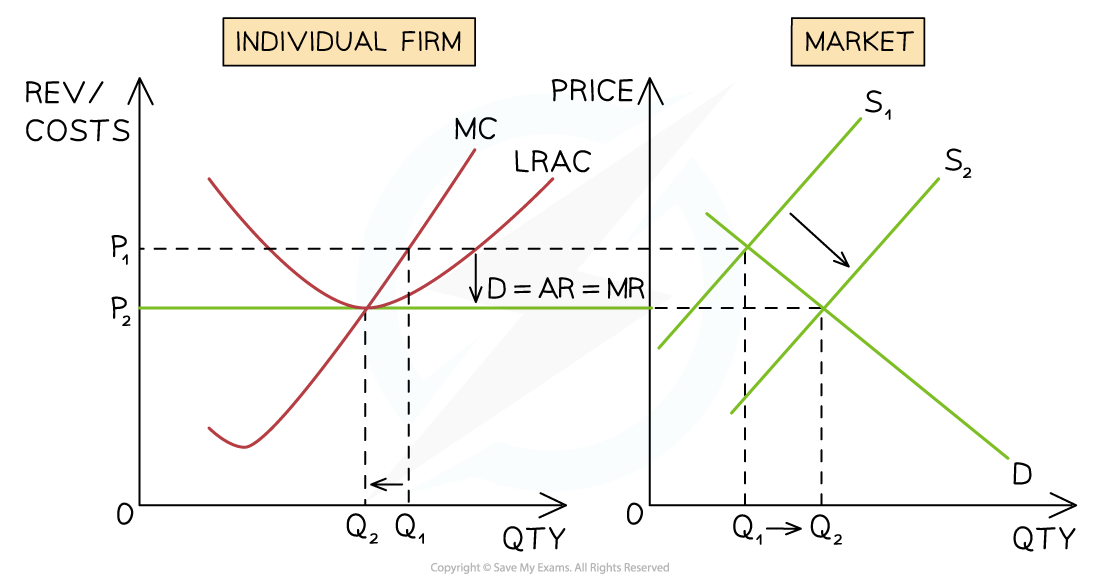
A diagram illustrating how new entrants shift the industry supply curve to the right (S1→S2?) which changes the industry price from P1→P2.?The firm can now only sell its products at P2?and supernormal profits are eliminated
Diagram Analysis
- The firm is initially producing at the?profit maximisation level of output?where?MC=MR (Q1)
- At this level of output, the AR (P1) > AC (P2) & the firm is making supernormal profit
- Incentivised by profit, new entrants join the industry &?supply increases from S1→S2
- Overall quantity in the industry increases from Q1→Q2
- The?industry price falls?from P1→P2
- The firm now has to sell its products at the industry price of P2
- The?output of the firm falls?from Q1→Q2?as it now has a?smaller market share?of the larger industry
- At the profit maximisation level of output (MC=MR) the firm is now producing at the point where AR= AC
- The firm is making?normal profit
- In the long-run,?firms in?perfect competition?always make?normal profit
- Firms making a?loss?leave the industry
- Firms making?supernormal profit?see them slowly?eradicated?as new firms join the industry
Moving From Short-run Losses to Long-run Equilibrium
- If firms in?perfect competition?make losses?in the?short-run,?some will shut down
- The?shut down rule?will determine which firms shut down
- There are no?barriers to exit, so it is easy to leave the industry
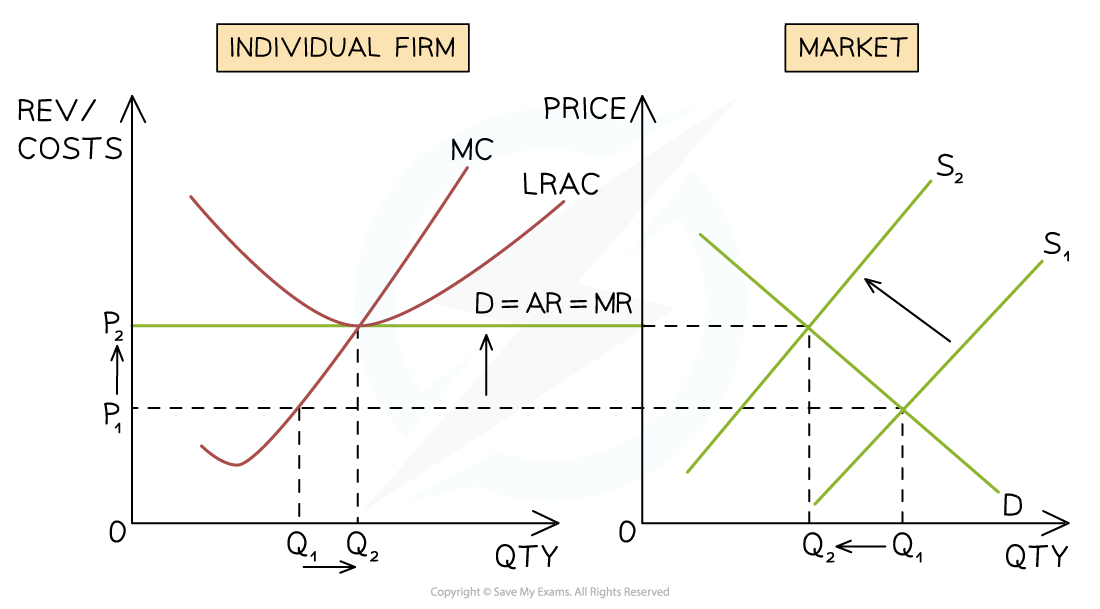
A diagram illustrating how firms leaving the industry shifts the industry supply curve to the left (S1→S2?) which changes the industry price from P1→P2.?The firm can now only sell its products at P2?which returns it to a position of normal profit
Diagram Analysis
- The firm is initially producing at the?profit maximisation level of output?where?MC=MR (Q1)
- At this level of output, the AR (P1) < AC (C1) & the firm is making a loss
- Some firms leave the industry &?supply decreases from S1→S2
- Overall quantity in the industry?falls from Q1→Q2
- The?industry price increases?from P1→P2
- The firm now has to sell its products at the industry price of P2
- The?output of the firm increases?from Q1→Q2?as it now has a?larger market share?of the smaller industry
- At the?profit maximisation level of output (MC=MR)?the firm is now producing at the point where AR= AC
- The firm is making?normal profit
- In the long-run,?firms in?perfect competition?always make?normal profit
- Firms making a?loss?leave the industry
- Firms making?supernormal profit?see them slowly?eradicated?as new firms join the industry
轉載自savemyexams
以上就是關于【Edexcel A Level Economics A:復習筆記3.4.2 Perfect Competition】的解答,如需了解學校/賽事/課程動態,可至翰林教育官網獲取更多信息。
往期文章閱讀推薦:
翰林獨家 | 經濟學競賽核心精講,一冊打通NEC/IEO/USAEBO!
2026 ALEVEL 夏考A率出爐!愛德思vs牛津AQA,哪些科目真的“好出分”?


翰林AMC8視頻課重磅上線!

國際競賽真題資源免費領取






