Edexcel A Level Economics A:復習筆記2.3.1 Characteristics of AS

The Aggregate Supply (AS) Curve
- Aggregate supply?is the total supply of goods/services produced within an economy at a?specific price level at a given time
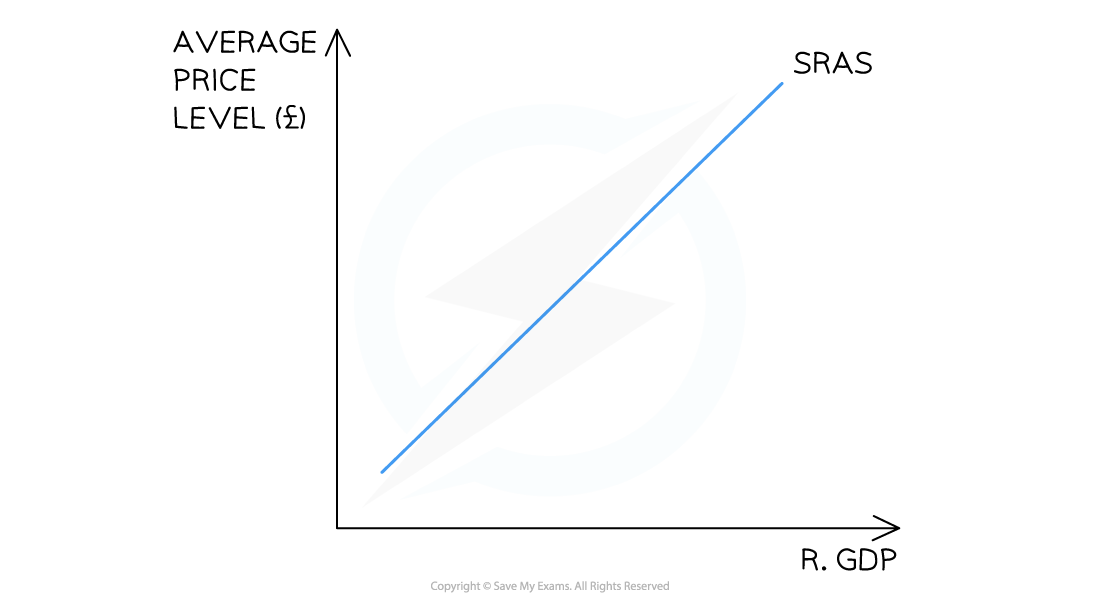
A diagram showing the upward sloping short run aggregate supply (SRAS) curve for an economy
- The AS curve is?upward sloping?due to two reasons
- The?aggregate supply?is the combined supply of?all individual supply curves?in an economy which are also upward sloping
- As?real output?increases, firms have to spend more to increase?production?e.g. wage bills will increase
- Increased costs result in?higher average prices
A Movement Along the SRAS Curve
- Whenever there is a change in the?average price level (AP)?in an economy, there is a?movement along?the short run aggregate supply (SRAS) curve
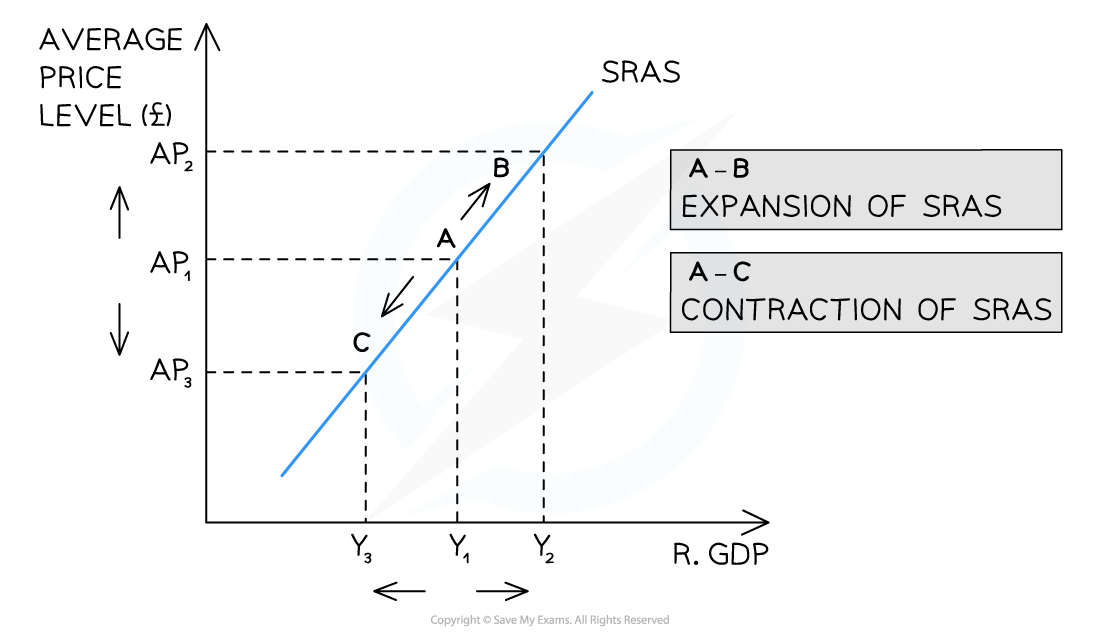
A diagram showing an increase and decrease in the average price level (AP) which causes a movement along the short run aggregate supply (SRAS) curve leading to a contraction/expansion of SRAS
Diagram Analysis
- An?increase in the AP?(ceteris paribus)?from?AP1?→ AP2?leads to a?movement?along the?SRAS curve from A → B
- There is an?expansion of real GDP?from?Y1?→ Y2
- A?decrease in the AP?(ceteris paribus) from?AP1?→ AP3?leads to a?movement?along the?SRAS curve from A → C
- There is a?contraction?of real GDP?(output) from?Y1→Y3
A Shift of the Entire SRAS Curve
- Whenever there is a?change?in the conditions of supply in an economy (e.g. costs of production or productivity changes), there is a?shift of the entire SRAS curve
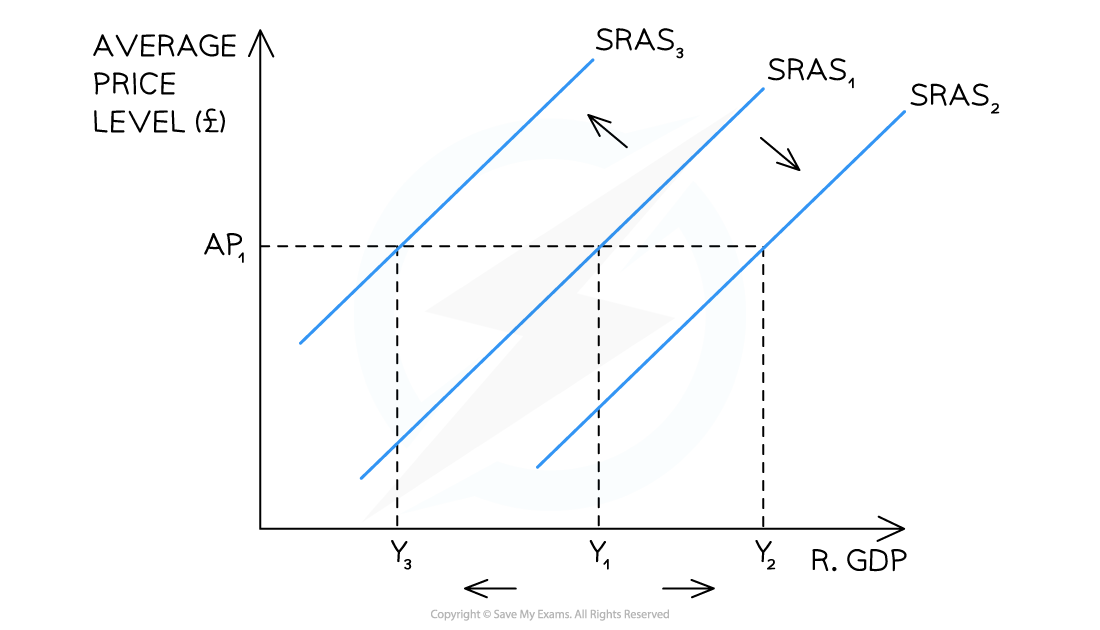
A diagram showing a shift in the entire short run aggregate supply (SRAS) curve due to a change in one of the conditions of supply in an economy
Diagram Analysis
- A?decrease?in costs or increase in?productivity?results in a?shift right?of the entire curve from?SRAS1?→ SRAS2
- At?every price level, output and real GDP has?increased from Y1?→ Y2
- An?increase?in costs or decrease in?productivity?results in a?shift left?of the entire curve from?SRAS1?→ SRAS3
- At?every price level, output and real GDP has?decreased from Y1?→ Y3
The Relationship Between Short-run & Long-run AS
- Short run aggregate supply (SRAS)?is influenced by changes in the?costs of production or productivity
- Short run refers to the time period where at least one?factor of production?is fixed
- Long run aggregate supply (LRAS)?is influenced by a change in the?productive capacity?of the economy
- Productive capacity is changed by changes to the?quantity or quality?of the?factors of production
- When production capacity changes, it is equivalent to a?shift inwards/outwards?of the?production possibilities frontier (PPF)
- Productive capacity is changed by changes to the?quantity or quality?of the?factors of production
- Long term economic growth?requires the productive capacity to increase
轉載自savemyexams
以上就是關于【Edexcel A Level Economics A:復習筆記2.3.1 Characteristics of AS】的解答,如需了解學校/賽事/課程動態,可至翰林教育官網獲取更多信息。
往期文章閱讀推薦:
翰林獨家 | 經濟學競賽核心精講,一冊打通NEC/IEO/USAEBO!
2026 ALEVEL 夏考A率出爐!愛德思vs牛津AQA,哪些科目真的“好出分”?


翰林AMC8視頻課重磅上線!

國際競賽真題資源免費領取






