Edexcel A Level Economics A:復習筆記2.2.1 The Characteristics of AD

The Components of AD
- Aggregate demand (AD)?is the?total demand?for all goods/services in an economy at any given?average price level
- Its value is often calculated using the?expenditure approach
- AD?= Consumption?(C)?+ Investment?(I)?+ Government spending?(G)?+ (Exports-Imports)?(X-M)
- AD = C + I + G + (X-M)
- If?AD increases?then?economic growth?has occurred and vice versa
- Consumption?is the total spending on goods/services?by consumers?(households) in an economy
- Investment?is the total spending on?capital goods?by firms
- Government spending?is the total spending by the?government?in the economy:
- Includes public sector salaries, payments for provision of merit and public goods etc.
- It does not include?transfer payments
- Net exports?are the difference between the?revenue gained?from selling goods/services abroad and the?expenditure?on goods/services from abroad
- Individuals, firms and governments export/import
The relative importance of the components of AD
- Depending on the country, the?value of each component?and its?contribution to AD?can vary significantly:
- Government spending?in Sweden is?53% of AD?and in the?UK, it is 25% of AD
- The % that each component?contributes to AD?in the UK is approximately
- Consumption: 60%
- Investment: 14%
- Government spending: 25%
- Net Exports: 1%
- A 1 % increase in?consumption?or government spending?will have a much?larger impact on economic growth?than a 1% increase on net exports
The AD Curve
- The relationship between the?average price level?and?the total output?in an economy is shown with an?aggregate demand (AD) curve
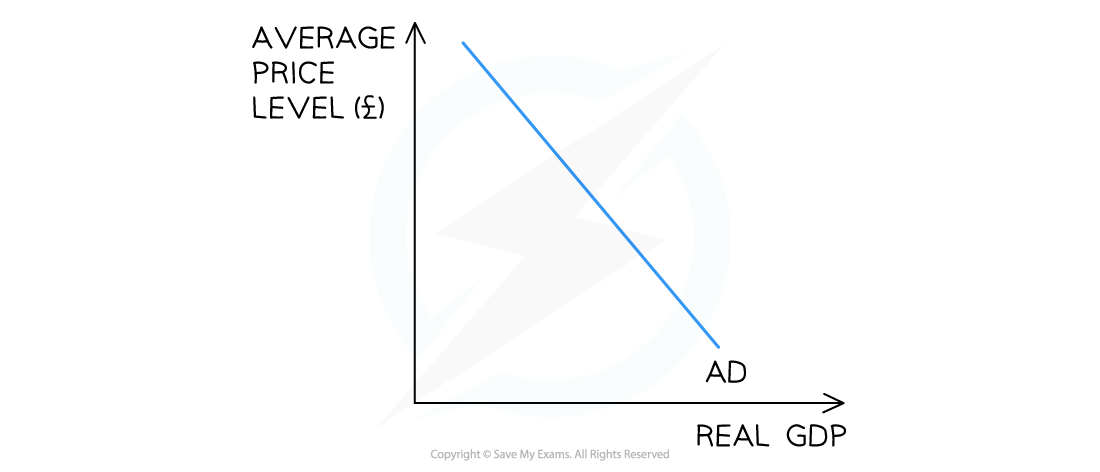
A diagram showing the aggregate demand (AD) curve for an economy with Average Price Level on the Y axis and Real GDP on the X axis
- The AD curve is?downward sloping?due to?three reasons:
- The?interest?rate effect:?At?higher average price (AP) levels, there are likely to be?higher interest rates.?Higher interest rates?reduce investment?and are an?incentive for households to save - and?vice versa
- The wealth effect:?As?AP increases, the?purchasing power?of households?decreases?and the AD falls - and vice versa
- The exchange rate effect:?As?AP falls,?interest rates?are likely to?fall?too. Lower interest rates lower the exchange rate.?With a lower exchange rate, the economy's?goods/services are more attractive?abroad and?exports increase, thereby?increasing real GDP
A Movement Along The AD Curve
- Whenever there is a change in the?average price level (AP)? in an economy, there is a?movement along?the aggregate demand (AD) curve
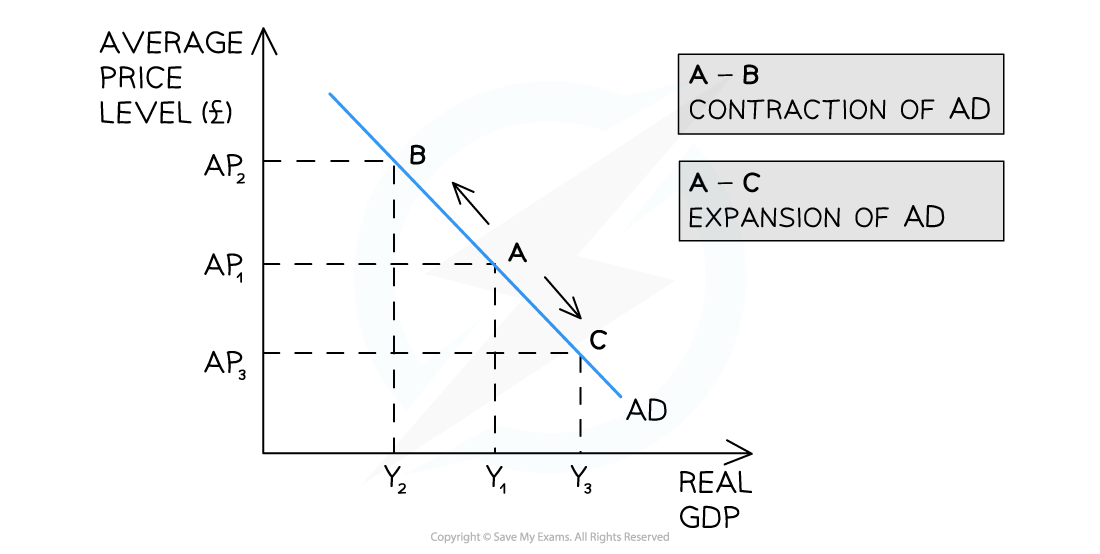
A diagram showing an increase and decrease in the average price level (AP) which causes a movement along the aggregate demand (AD) curve leading to a contraction/expansion of AD
Diagram Analysis
- An?increase in the AP?(ceteris paribus)?from?AP1?→ AP2?leads to a?movement?along the?AD curve from A → B
- There is a?contraction of real GDP?from Y1?→ Y2
- A?decrease in the AP?(ceteris paribus) from?AP1?→ AP3?leads to a?movement?along the?AD curve from A → C
- There is an?expansion of real GDP?(output) from Y1?→ Y3
A Shift of the Entire AD Curve
- Whenever there is a?change?in any of the?determinants ofaggregate demand (AD)?in an economy, there is a?shift of the entire AD curve
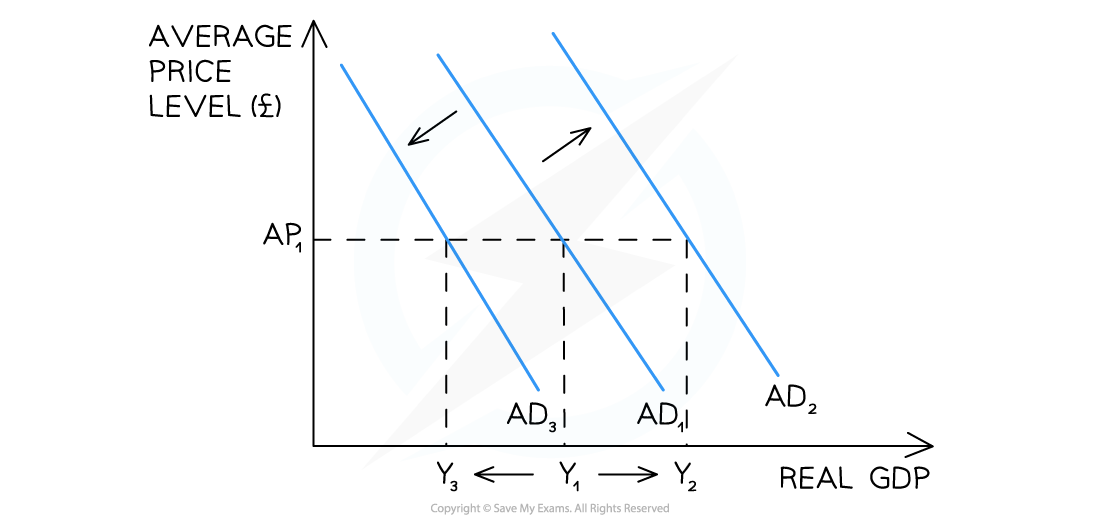
A diagram showing a shift in the entire aggregate demand (AD) curve due to a change in one of the determinants of AD
Diagram Analysis
- An?increase?in any one of the?determinants ofaggregate demand (AD)?results in a?shift right?of the entire curve from?AD1?→ AD2
- At?every price level, real GDP has?increased from Y1?→ Y2
- A?decrease?in any one of the?determinants of AD?results in a?shift left?of the entire curve from?AD1?→ AD3
- At?every price level, real GDP has?decreased from Y1?→ Y3
轉載自savemyexams
以上就是關于【Edexcel A Level Economics A:復習筆記2.2.1 The Characteristics of AD】的解答,如需了解學校/賽事/課程動態,可至翰林教育官網獲取更多信息。
往期文章閱讀推薦:
MIT官方發布【2026年夏季推薦閱讀書單】!橫跨科學/人文/經濟...
全網破防!ALevel CIE數學M1疑似錯題?經濟P2難度飆升?5月6日大考考情分析必看!


翰林AMC8視頻課重磅上線!

國際競賽真題資源免費領取


