Edexcel A Level Economics A:復習筆記1.2.6 Price Determination

Price Determination & Equilibrium
Price Determination
- In a?free market?economy, prices are determined by the?interaction of demand and supply?in a?market
- A?market?is any place that brings?buyers?and?sellers?together
- Markets can be?physical?(e.g. Waterstones) or?virtual?(e.g. eBay)
- Buyers and sellers meet to?trade?at an?agreed price
- Buyers agree the price?by purchasing?the good/service
- If they do not agree on the price then they?do not purchase?the good/service and are exercising their?consumer sovereignty
- Based on this interaction with buyers,?sellers?will gradually?adjust their prices?until there is an?equilibrium price?and?quantity?that works for both parties
- At the equilibrium price,?sellers?will be satisfied with the?rate/quantity?of sales
- At the equilibrium price, the?utility/price?combination is maximised for the buyers
Equilibrium
- Equilibrium in a market occurs when?demand = supply
- At this point the price is called the?market clearing price
- This is the?price?at which sellers are clearing their stock?at an acceptable rate
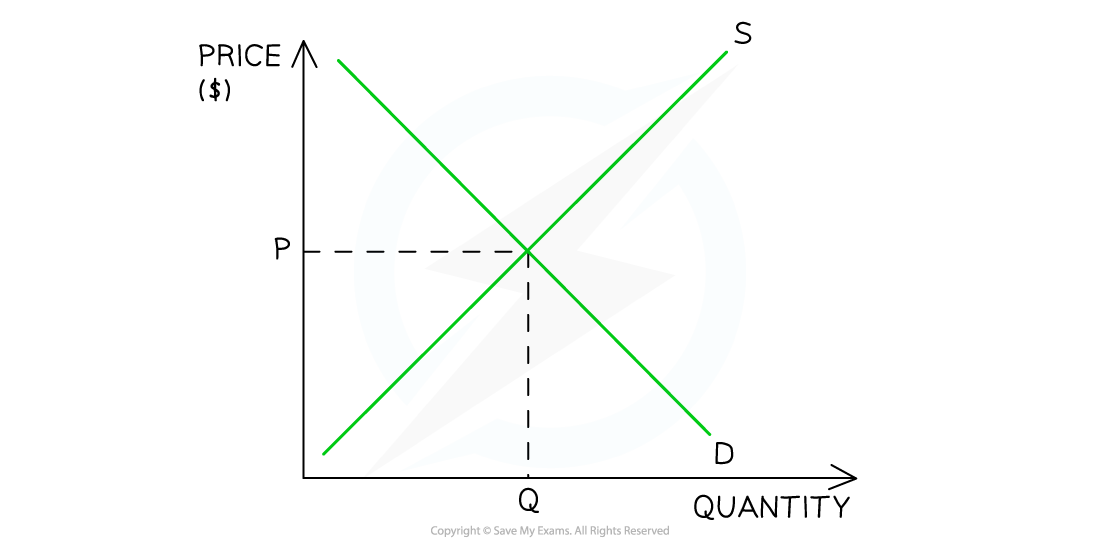
A graph showing a market in equilibrium with a market clearing price at P and quantity at Q
- Any price?above or below?P creates?disequilibrium?in this market
- Disequilibrium occurs whenever there is?excess demand?or?supply?in a market
Market Disequilibrium
Disequilibrium - Excess Demand
- Excess demand?occurs when the demand?is greater?than the supply
- It can occur when?prices are too low?or when?demand is so high?that supply cannot keep up with it
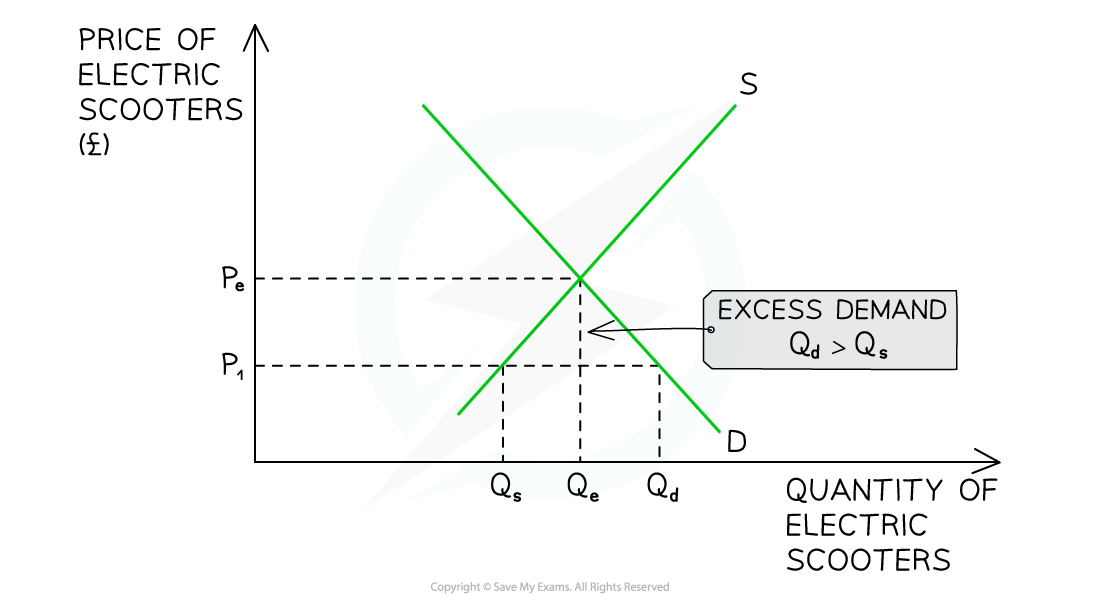
A graph that depicts the condition of excess demand in the market for electric scooters
Diagram Analysis
- At a price of P1, the?quantity demanded?of electric scooters (Qd) is?greater?than the?quantity supplied?(Qs)
- There is a?shortage?in the market equivalent to?QsQd
Market response
- This market is in?disequilibrium
- Sellers are frustrated that products are selling so quickly at a?price?that is obviously?too low
- Some buyers are frustrated as they will?not be able to purchase?the product
- Sellers realise they can?increase prices?and generate more?revenue?and?profits
- Sellers gradually?raise prices
- This causes a?contraction in QD?as some buyers?no longer desire?the good/service at a higher price
- This causes an?extension in QS?as sellers are more?incentivised to supply?at higher prices
- In time, the market will have?cleared the excess demand?and arrive at a position of?equilibrium (PeQe)
- Different markets take different lengths of?time to resolve disequilibrium. For example, retail clothing can do so in a few days. Whereas the housing market may take several months
Disequilibrium - Excess Supply
- Excess supply?occurs when the supply?is greater?than the demand
- It can occur when?prices are too high?or when?demand falls unexpectedly
- During the later stages of the pandemic the market for face masks was in?disequilibrium
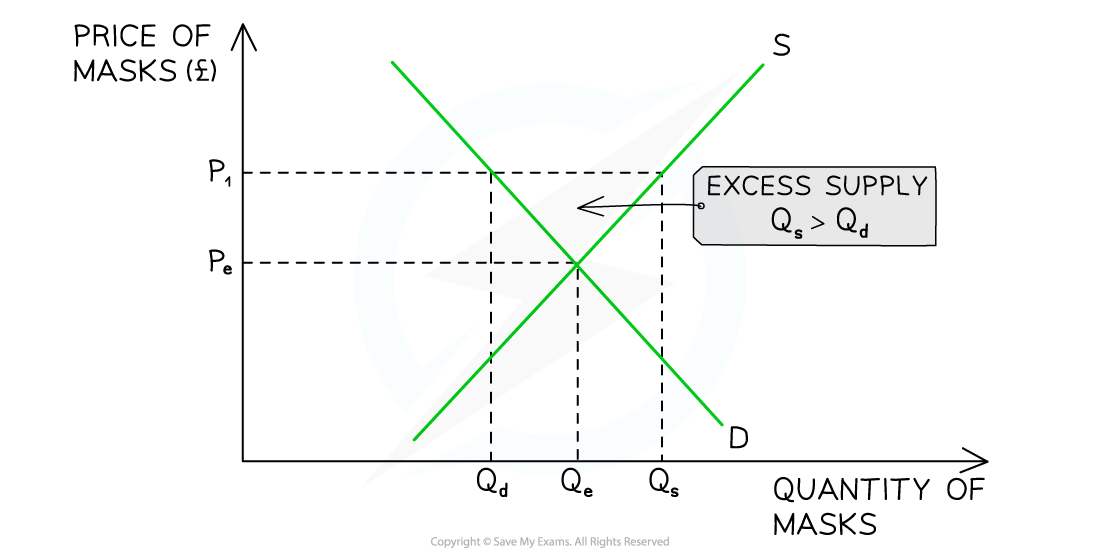
A graph that depicts the condition of excess supply in the market for Covid-19 face masks during the later stages of the pandemic
Diagram Analysis
- At a price of P1, the?quantity supplied?of face masks (Qs) is?greater?than the?quantity demanded?(Qd)
- There is a?surplus in the market?equivalent to?QdQs
Market Response
- This market is in?disequilibrium
- Sellers are frustrated that the masks are?not selling?and that the?price?is obviously?too high
- Some buyers are frustrated as they?want to purchase?the masks but are not willing to?pay the high price
- Sellers will gradually lower?prices?in order to generate more?revenue
- This causes a?contraction in QS?as some sellers?no longer desire?to supply masks
- This causes an?extension in QD?as buyers are?more?willing?to purchase masks at?lower prices
- In time, the market will have?cleared the excess supply?and arrive at a position of?equilibrium (PeQe)
Use of Diagrams to Show Market Changes
- Real world markets?are constantly changing and are referred to as?dynamic markets
- Market equilibrium?can change every few minutes in some markets (e.g. stocks and shares), or every few weeks or months in others (e.g clothing)
- ?Any change to a?condition of demand or supply?will temporarily create?disequilibrium?and market forces will then seek to clear the?excess demand or supply
Real World Example: Changes to Demand That Increase Price
- During lock downs associated with the Covid-19 pandemic, furniture retailers experienced?unexpectedly high demand?for their products (especially desks and sofas)
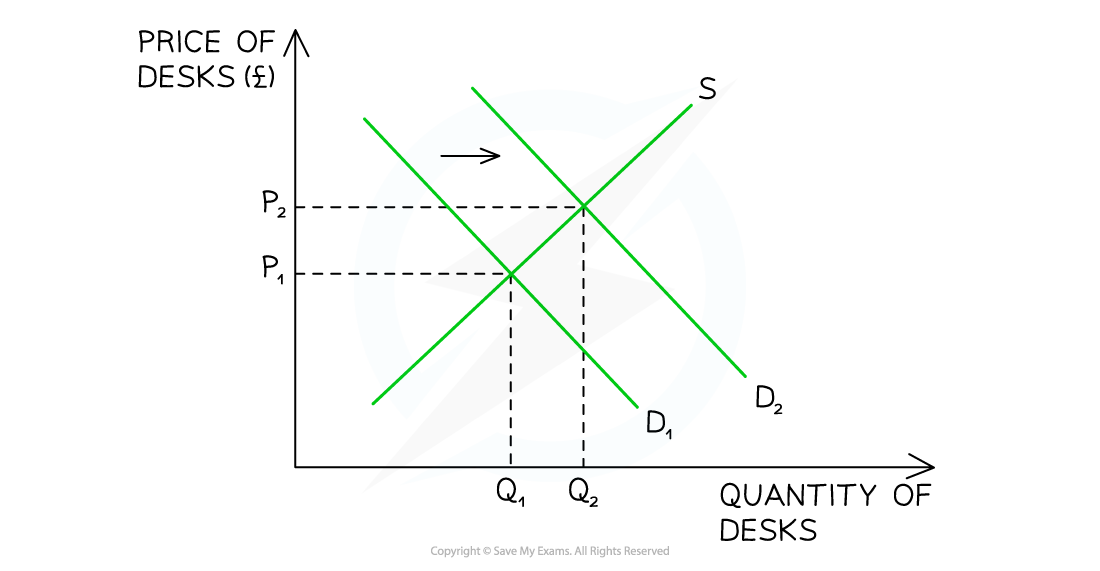
Diagram showing an increase in demand for desks due to a temporary change in tastes/fashions
Diagram Analysis
- Due to the Covid mandated change of?working from home, consumers experienced a temporary?change in taste?as they sought to?set up?comfortable?home offices
- This led to an?increase in demand?for desks from D1→D2
- At the?original?market clearing price of P1, a condition of?excess demand?now exists
- The demand for desks is?greater?than the supply
- In response, suppliers?raise prices
- This causes a?contraction of demand?and an?extension of supply?leading to a?new market equilibrium?at P2Q2
- Both the?equilibrium price (P2)?and the?equilibrium quantity (Q2)?are higher than before
- The?excess demand?in the market has been cleared
Real World Example: Changes to Supply That Increase Price
- Ukraine is one of the world's largest?producers?of wheat. During the Russian-Ukrainian war,?exports?of wheat have been halted
- India imported 13% of the nation's wheat requirements from the Ukraine
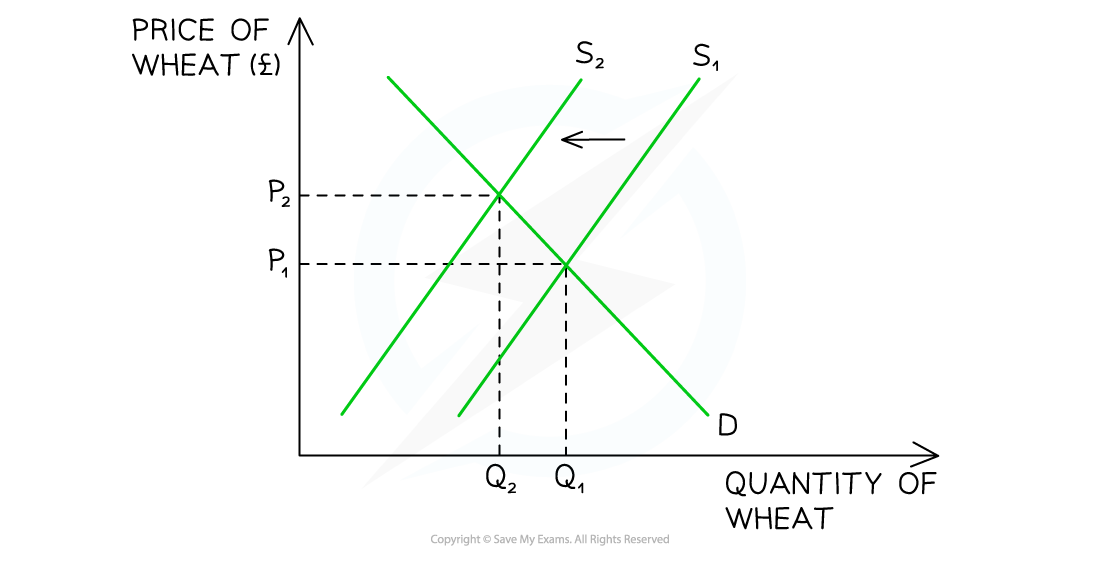
Diagram showing an decrease in supply of wheat in India due to a supply shock caused by the war in Ukraine
Diagram Analysis
- Due to the war in the Ukraine, India is experiencing a?supply shock?in its wheat market
- This causes a?decrease in supply?of S1→S2
- At the?original?market clearing price of P1, a condition of?excess demand?now exists (shortage)
- The demand for wheat is?greater?than the supply
- In response, sellers in India?raise prices
- This causes a?contraction of demand?and an?extension of supply?leading to a?new market equilibrium?at?P2Q2
- The?equilibrium price (P2)?is higher and the equilibrium quantity (Q2)?is lower than before
- The?excess demand?in the market has been cleared
Real World Example: Changes to Demand That Decrease Price
- Demand for lobsters in Maine, USA has been?falling?steadily in recent months
- This has resulted in a?price fall?from $12.35 /pound on the 1st April to $9.35 /pound on the 1st May
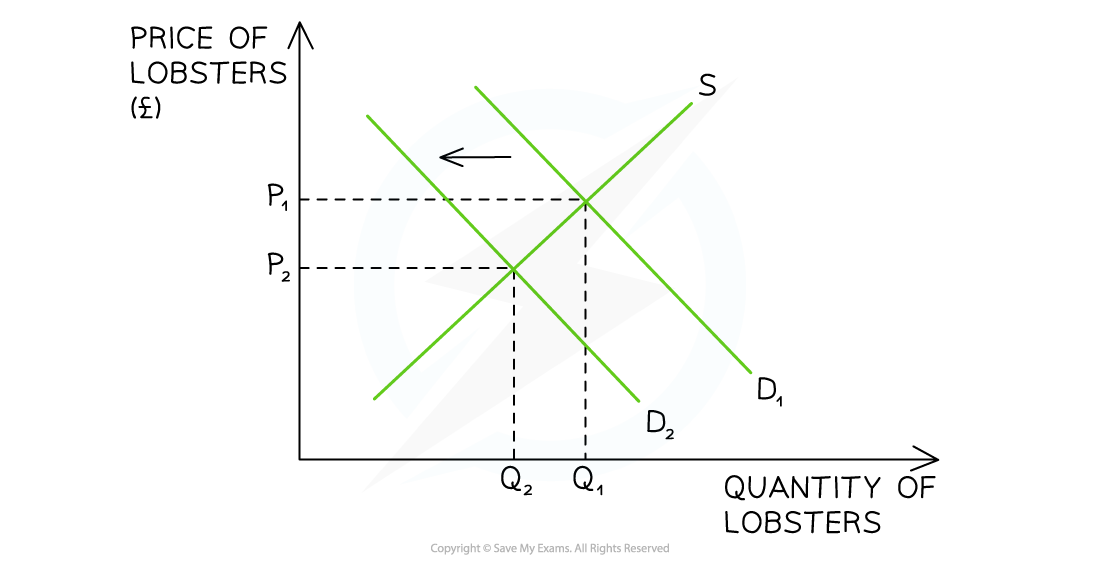
Diagram showing a decrease in demand for lobsters due to a decrease in real income
Diagram Analysis
- In recent months the USA has been experiencing an?increasing rate?of?inflation
- Inflation lowers the?purchasing power?of money in a consumer's pocket and so effectively reduces their?real income
- With reduced real income?fewer luxuries?are consumed
- This led to a?decrease in demand?for lobsters from?D1→D2
- At the?original?market clearing price of P1, a condition of?excess supply?now exists
- The?demand?for lobsters is?less?than the?supply
- In response, suppliers gradually?reduce prices
- This causes a?contraction of supply?and an?extension of demand?leading to a?new market equilibrium?in P2Q2
- Both the?equilibrium price (P2)?and the?equilibrium quantity (Q2)?are lower than before
- The?excess supply?in the market has been cleared
Real World Example: Changes to Supply That Decrease Price
- In order to help meet their?climate targets?and to lower energy costs for households, the EU is providing?subsidies?for solar panels

Diagram showing an increase in supply of solar panels in the EU due to a per unit subsidy
Diagram Analysis
- To help meet its climate change targets and lower household energy bills the EU has provided a?subsidy to solar panel retailers
- This causes an?increase in supply?of S1→S2
- At the?original?market clearing price of P1, a condition of?excess supply?now exists (surplus)
- The supply of solar panels is?greater?than the demand
- In response, sellers in the EU?lower prices
- This causes an?extension?of demand?and a?contraction of supply?leading to a?new market equilibrium?at?P2Q2
- The?equilibrium price (P2)?is lower and the equilibrium quantity (Q2)?is higher than before
- The?excess supply?in the market has been cleared
Exam Tip
MCQ, short answer and essay questions frequently require you to explain?dynamic changes?in markets. Explaining the steps in the change is often referred to as?chains of analysis?and students frequently leave out some steps in the chain.
Step 1:?From the scenario, identify if the change in condition is on the demand side?or?supply side.
Step2:?State which way the demand or supply curve moves and use notation e.g. S1→S2.
Step 3:?State the disequilibrium that now exists at the?original market price.
Step 4:?State if sellers raise or lower prices to clear the?disequilibrium.
Step 5:?Explain the relevant?contraction?and?extension?that occurs on the demand and supply curves due to the change in price.
Step 6:?State the new market equilibrium points e.g. P2Q2.
Step 7:?Explain the?market outcome?(is the new price/quantity higher/lower than the original?)
轉載自savemyexams
以上就是關于【Edexcel A Level Economics A:復習筆記1.2.6 Price Determination】的解答,如需了解學校/賽事/課程動態,可至翰林教育官網獲取更多信息。
往期文章閱讀推薦:
翰林獨家 | 經濟學競賽核心精講,一冊打通NEC/IEO/USAEBO!
2026 ALEVEL 夏考A率出爐!愛德思vs牛津AQA,哪些科目真的“好出分”?


翰林AMC8視頻課重磅上線!

國際競賽真題資源免費領取






