IB DP Physics: SL復(fù)習(xí)筆記2.1.4 Graphs Describing Motion

Motion Graphs
- Three types of graphs that can represent motion are?displacement-time?graphs,?velocity-time?graphs, and?acceleration-time?graphs
Displacement-Time Graph
- On a?displacement-time graph…
- Slope?equals?velocity
- The?y-intercept?equals the?initial displacement
- A?straight(diagonal) line represents a?constant?velocity
- A?curved?line represents an?acceleration
- A?positive?slope?represents motion in the?positive?direction
- A?negative?slope?represents motion in the?negative?direction
- A?zero?slope (horizontal line) represents a state of?rest
- The area under the curve is meaningless
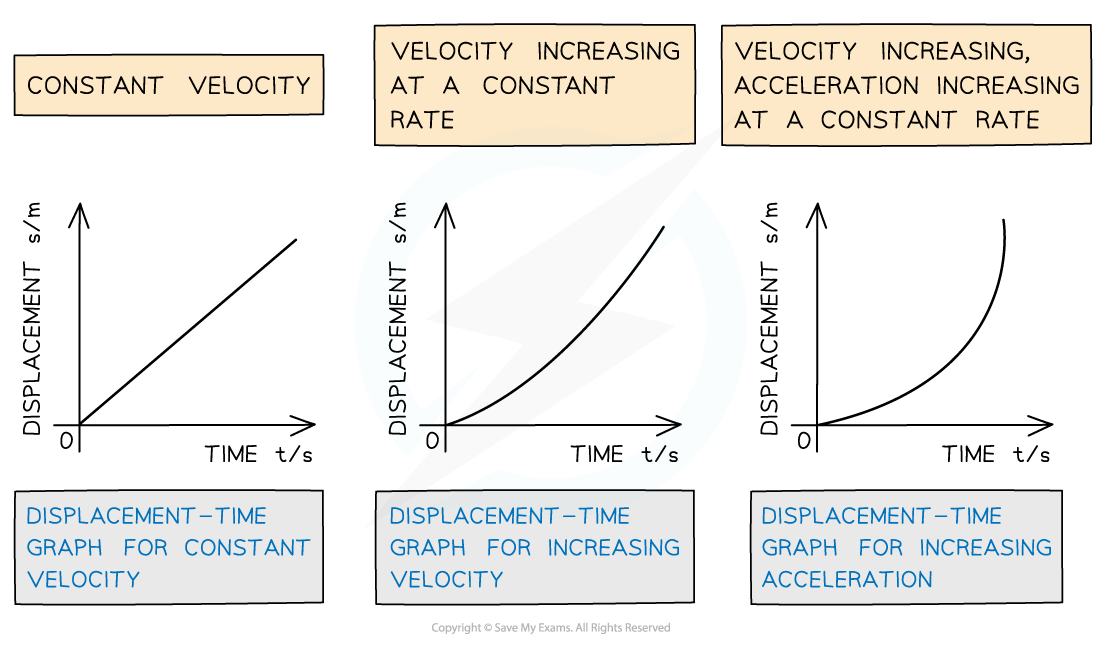 Displacement-time graphs displacing difference velocities
Velocity-Time Graph
- On a?velocity-time graph…
- Slope?equals?acceleration
- The?y-intercept?equals the?initial velocity
- A?straight?line represents?uniform?acceleration
- A?curved?line represents?non-uniform acceleration
- A?positive?slope represents an?increase?in?velocity?in the?positive?direction
- A?negative?slope represents an?increase?in?velocity?in the?negative?direction
- A?zero?slope (horizontal line) represents motion with?constant?velocity
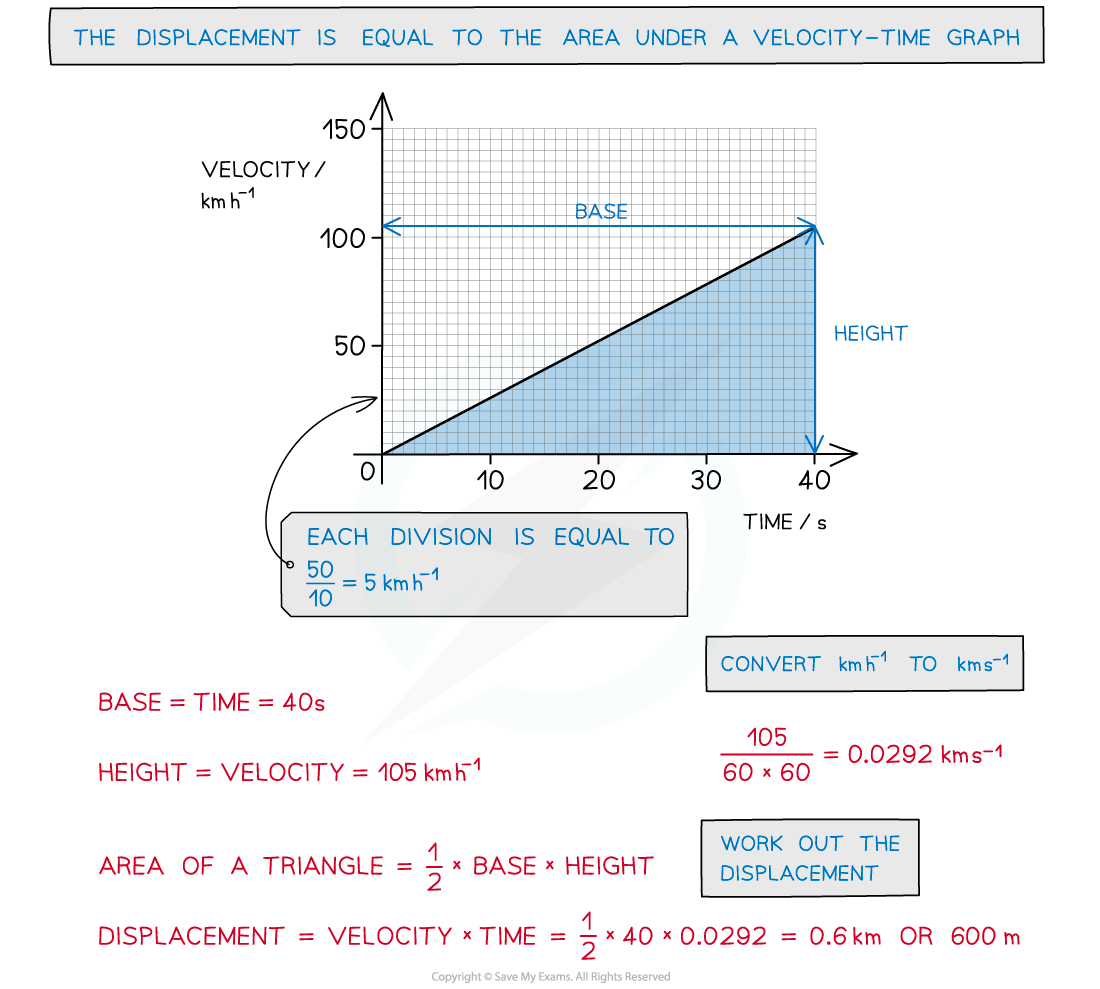
- The?area?under the curve equals the?change?in?displacement
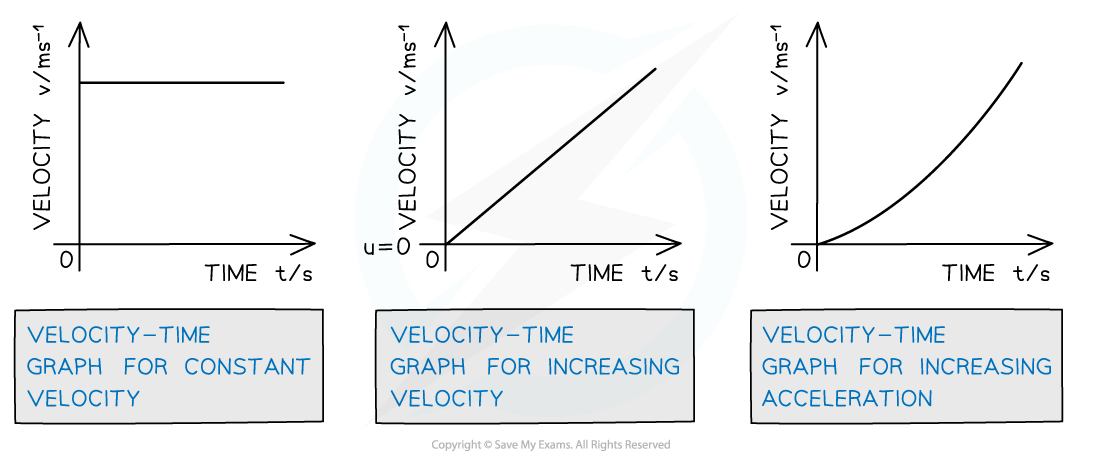 Velocity-time graphs displacing different acceleration
Acceleration-Time Graph
- On an?acceleration-time graph…
- Slope is meaningless
- The?y-intercept?equals the?initial acceleration
- A?zero slope?(horizontal line) represents an object undergoing?constant acceleration
- The?area?under the curve equals the?change?in?velocity
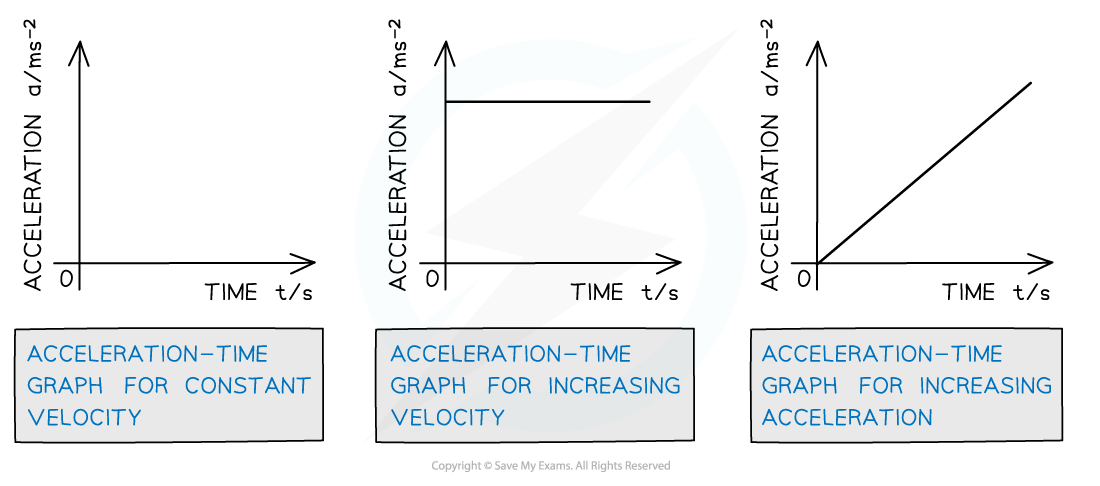
How displacement, velocity and acceleration graphs relate to each other
Worked Example
Tora is training for a cycling tournament.
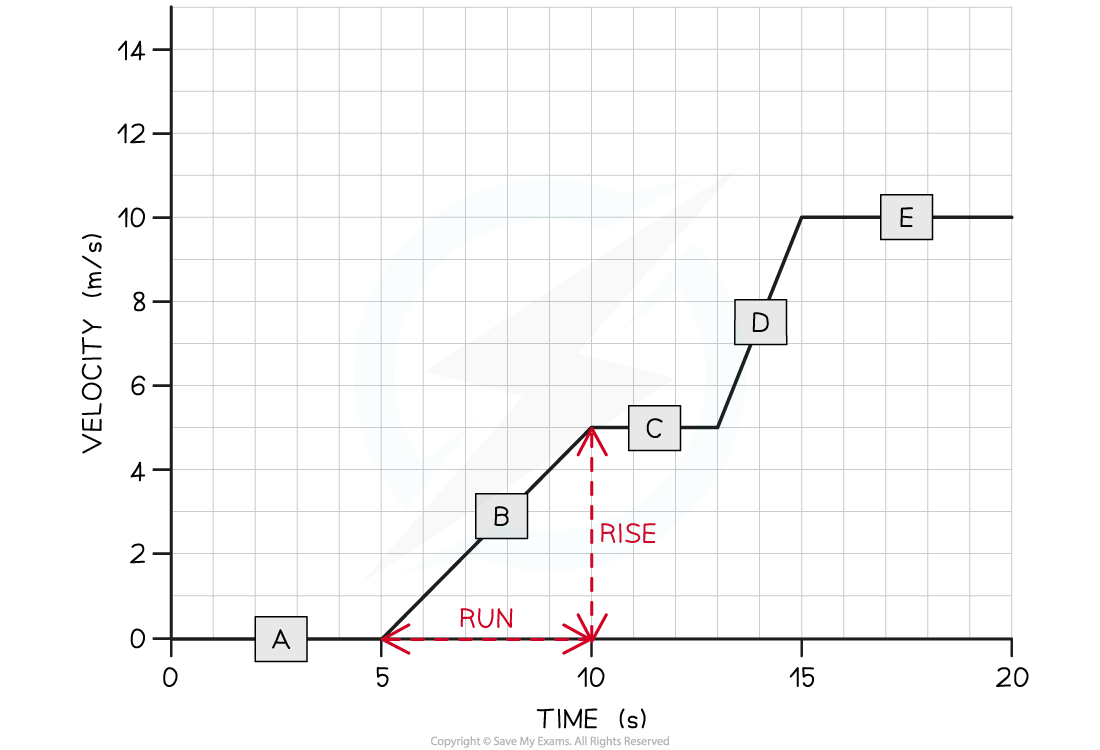
The velocity-time graph below shows her motion as she cycles along a flat, straight road.
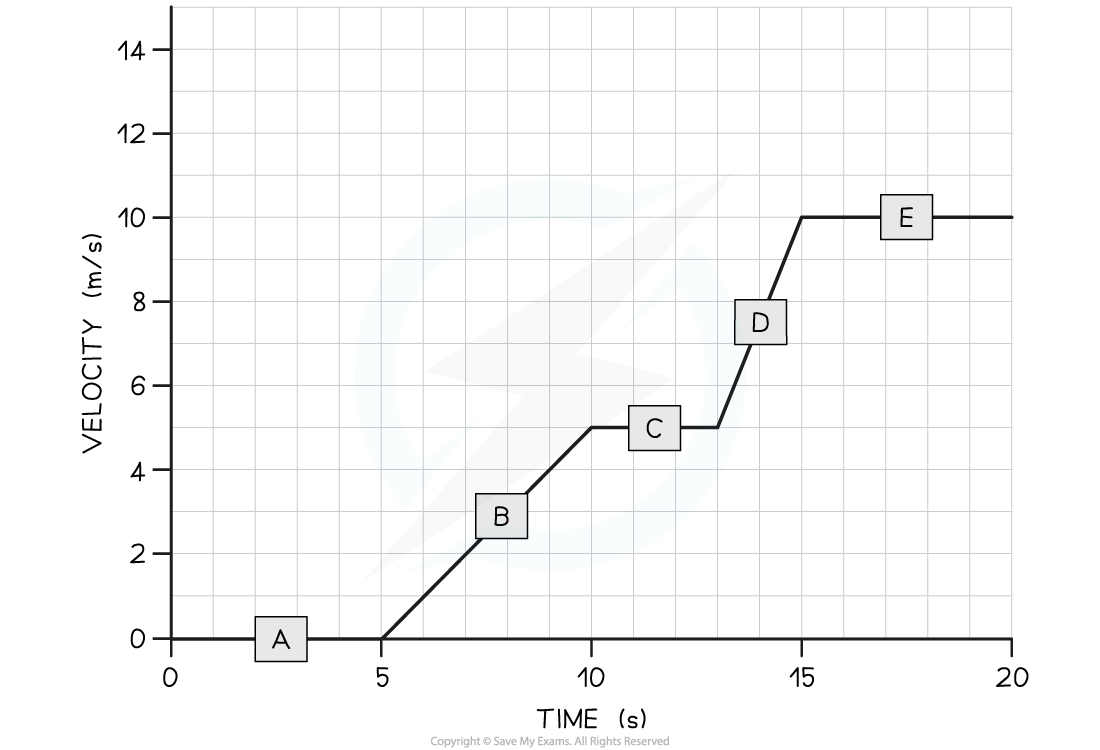
(a) In which section (A, B, C, D, or E) of the velocity-time graph is Tora’s acceleration the largest?(b) Calculate Tora’s acceleration between 5 and 10 seconds.
Part (a)
Step 1:?Recall that the slope of a velocity-time graph represents the magnitude of acceleration
-
-
- The slope of a velocity-time graph indicates the magnitude of accelerationTherefore, the only sections of the graph where Tora is accelerating is section B and section D
- Sections A, C, and E are flat – in other words, Tora is moving at a constant velocity (i.e. not accelerating)
-
Step 2: Identify the section with the steepest slope
-
-
- Section D of the graph has the steepest slope
- Hence, the largest acceleration is shown in?section D
-
Part (b)
Step 1: Recall that the gradient of a velocity-time graph gives the acceleration
-
-
- Calculating the gradient of a slope on a velocity-time graph gives the acceleration for that time period
-
Step 2: Draw a large gradient triangle at the appropriate section of the graph
-
-
- A gradient triangle is drawn for the time period between 5 and 10 seconds below:
-
Step 3: Calculate the size of the gradient and state this as the acceleration
-
-
- The acceleration is given by the gradient, which can be calculated using:
-
acceleration = gradient = 5 ÷ 5 = 1 m/s2
-
-
- Therefore, Tora accelerated at 1 m/s2?between 5 and 10 seconds
-
Motion of a Bouncing Ball
- For a bouncing ball, the acceleration due to gravity is?always?in the same direction (in a uniform gravitational field such as the Earth's surface)
- This is assuming there are?no?other forces on the ball, such as?air resistance
- Since the ball changes its direction when it reaches its highest and lowest point, the direction of the velocity will change at these points
- The vector nature of velocity means the ball will sometimes have a:
- Positive velocity?if it is traveling in the positive direction
- Negative velocity?if it is traveling in the negative direction
- An example could be a ball bouncing from the ground back upwards and back down again
- The positive direction is taken as upwards
- This will be either stated in the question or can be chosen, as long as the direction is consistent throughout
- Ignoring the effect of air resistance, the ball will reach the same height every time before bouncing from the ground again
- When the ball is traveling upwards, it has a positive velocity which slowly decreases (decelerates) until it reaches its highest point
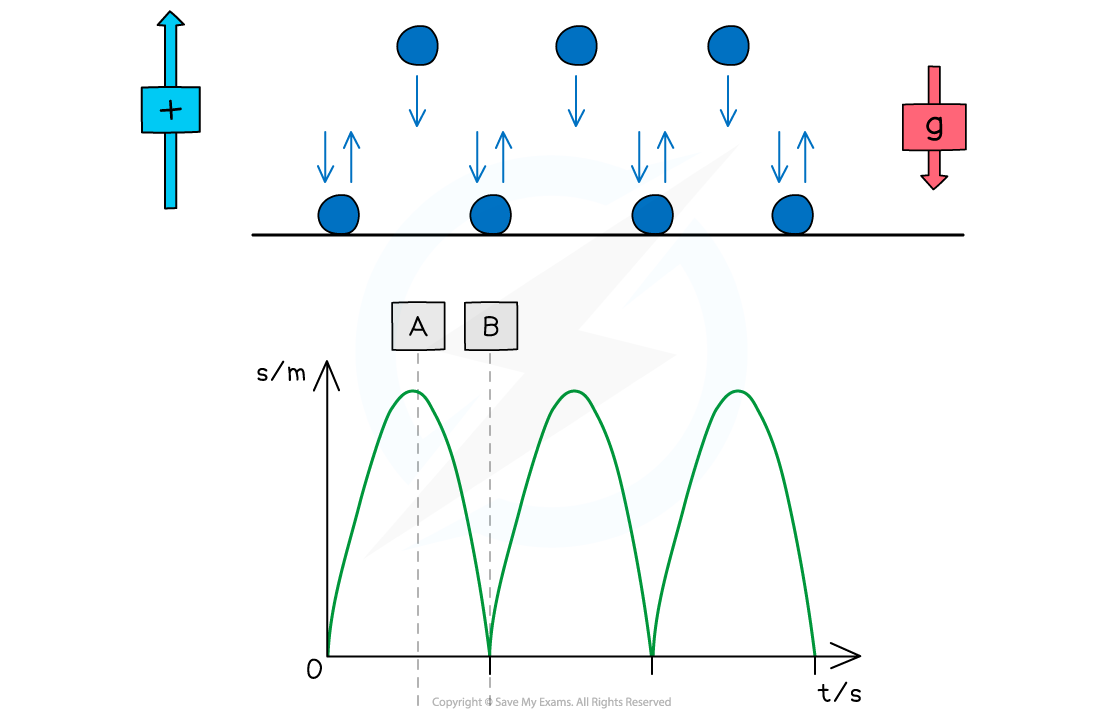
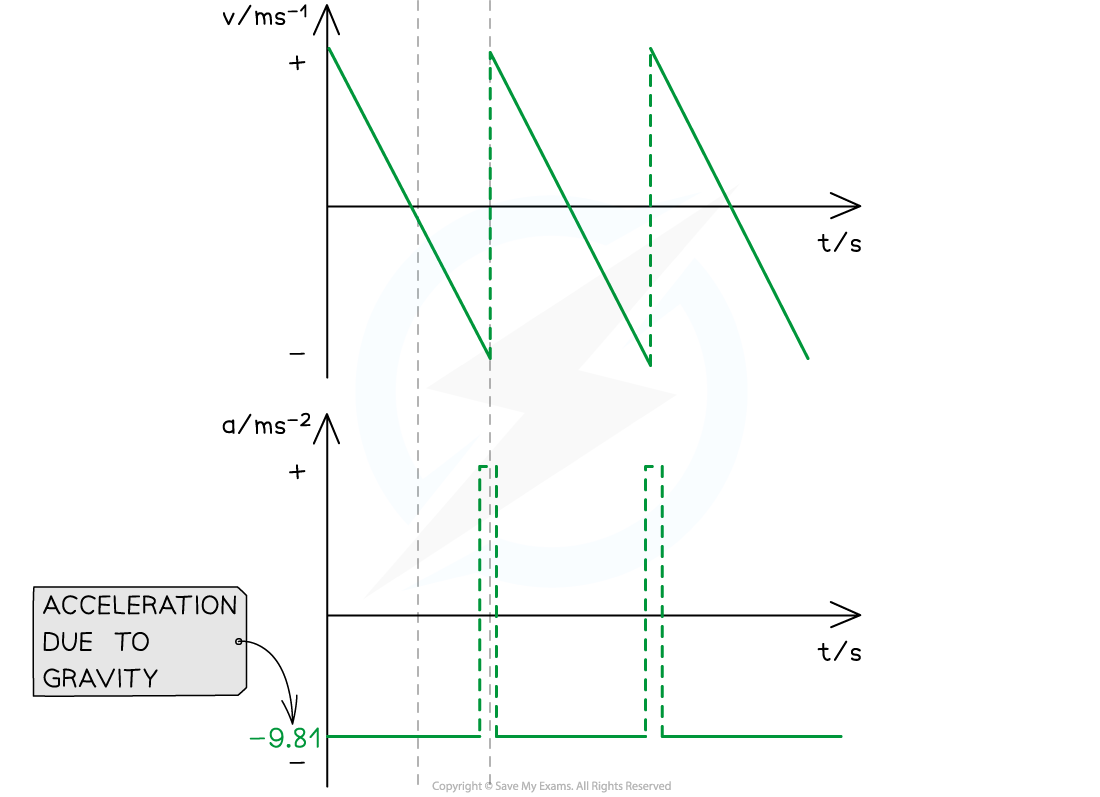
- At point?A?(the highest point):
- The ball is at its?maximum displacement
- The ball momentarily has?zero velocity
- The?velocity?changes from?positive?to?negative?as the ball changes direction
- The?acceleration,?g, is still?constant?and directed vertically downwards
- At point?B?(the lowest point):
- The ball is at its?minimum displacement?(on the ground)
- Its?velocity?changes instantaneously from?negative?to?positive, but its?speed?(magnitude)?remains the same
- The?change?in direction causes a?momentary acceleration?(since acceleration = change in velocity / time)
Worked Example
The velocity-time graph of a vehicle travelling with uniform acceleration is shown in the diagram below.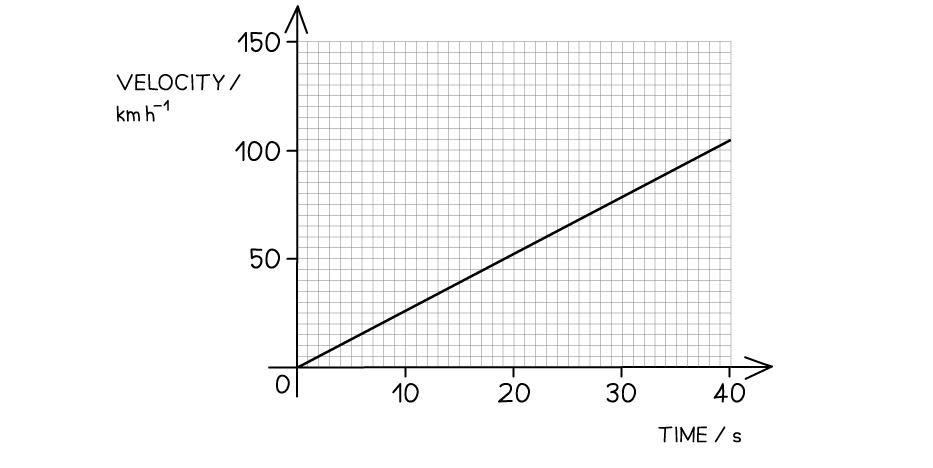 Calculate the displacement of the vehicle at 40 s.
轉(zhuǎn)載自savemyexams
以上就是關(guān)于【IB DP Physics: SL復(fù)習(xí)筆記2.1.4 Graphs Describing Motion】的解答,如需了解學(xué)校/賽事/課程動(dòng)態(tài),可至翰林教育官網(wǎng)獲取更多信息。
往期文章閱讀推薦:
翰林獨(dú)家 | 經(jīng)濟(jì)學(xué)競賽核心精講,一冊打通NEC/IEO/USAEBO!
2026 AMC10/12美國數(shù)學(xué)競賽新賽季!【翰林教育 × 清華大學(xué)出版社】獨(dú)家教材全面發(fā)售!


翰林AMC8視頻課重磅上線!

國際競賽真題資源免費(fèi)領(lǐng)取






