AQA A Level Biology復習筆記1.4.5 Maths Skill: Drawing a Graph for Enzyme Rate Experiments

Maths Skill: Drawing a Graph for Enzyme Rate Experiments
- Enzyme rate experiments?are experiments that are carried out to determine the?effect?of?changing?a particular?factor?on the?rate of a reaction?that is catalysed by an enzyme
- Factors that can be?changed?include:
- Temperature
- pH
- Enzyme concentration
- Substrate concentration
- The ways in which the?reaction rate?can be?measured?include:
- Measuring how much of a?product?is?made?in a?given time period?(e.g. using a gas cylinder to collect the oxygen produced from the breakdown of hydrogen peroxide by catalase)
- Measuring how much a?substrate?is?broken down?in a?given time period?(e.g. using iodine to determine how quickly starch is broken down into maltose by amylase)
- Line graphs?should be used to present the results of enzyme rate experiments
- The data should be plotted with the?independent?variable on the?x-axis?and the?dependent?variable on the?y-axis
- If a?trend?can be identified, a?line of best fit?(straight or curved) should be added to the graph
- If asked in an exam, you can use this line of best fit to?interpolate?(reading off values in between existing data points) or?extrapolate?(going beyond the range of existing data points to read off values)
- Using the graph and best fit line below, for example, you can use?interpolation?to conclude that, at a substrate concentration of?3?arbitrary units, the rate must have been?1.8?arbitrary units and you can use?extrapolation?to conclude that, at a substrate concentration of?10?arbitrary units, the rate will be?6?arbitrary units
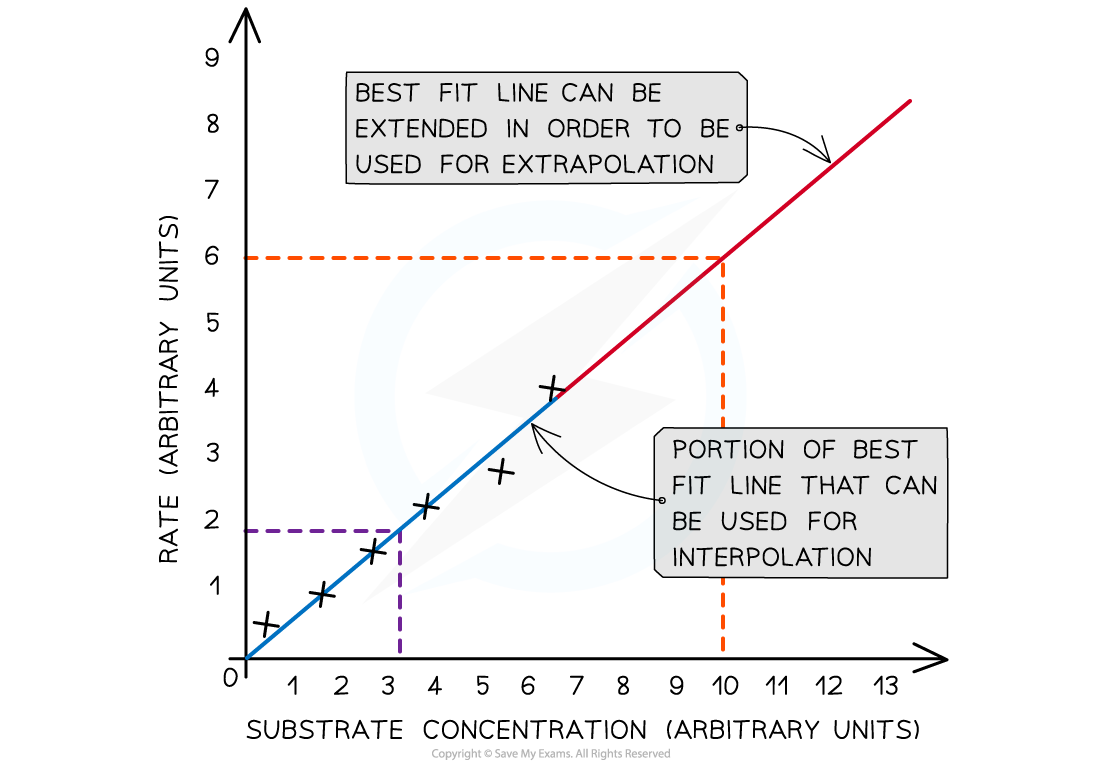
The results of an enzyme rate experiment, with substrate concentration as the independent variable
- For some enzyme rate experiment graphs, it may be necessary to plot?more than one?set of data on the?same graph
- For example, if investigating the effect of?temperature?on the rate of an enzyme-controlled reaction, you may need to plot a line graph with multiple lines, where each line represents the data collected at a specific temperature
- When drawing a graph like this, make sure to?clearly label each line
- An example is shown below:

The results of an enzyme experiment. It is the volume of product produced and not the rate of reaction that has been plotted on the y axis for this graph. The initial rate of reaction is represented by the initial gradient of the lines on the graph. As the temperature is the factor being manipulated it is the independent variable.
Tips for plotting line graphs
- When plotting?line graphs?for enzyme rate experiments, remember the following:
- Plot data points?accurately
- Use?appropriate?linear scales on axes
- Choose scales that enable?all data points?to be plotted?within?the graph area
- Label axes, with?units?included
- Make graphs that fill the space the exam paper gives you
- Draw a line (or curve) of best-fit to identify?trends. The line must be smooth and have a?balance?of data points?above?and?below?the line
- In some cases, the line of best fit should be drawn through the?origin, for example for rate–concentration graphs (the reaction cannot occur if the concentration of enzyme or substrate is 0). The line of best fit should?only?go through the origin if the data and trend?allow it
轉載自savemyexams
以上就是關于【AQA A Level Biology復習筆記1.4.5 Maths Skill: Drawing a Graph for Enzyme Rate Experiments】的解答,如需了解學校/賽事/課程動態,可至翰林教育官網獲取更多信息。
往期文章閱讀推薦:
翰林獨家 | 經濟學競賽核心精講,一冊打通NEC/IEO/USAEBO!
2026 ALEVEL 夏考A率出爐!愛德思vs牛津AQA,哪些科目真的“好出分”?


翰林AMC8視頻課重磅上線!

國際競賽真題資源免費領取






