Edexcel A Level Physics:復習筆記1.5 Scientific Communication

Scientific Communication
- Scientific communication of the results of an experiment are extremely important
- The ideas must be communicated in an appropriate way using appropriate terminology
- This involves using terms such as?accuracy,?validity?and stating the sources of?random?and?systematic?errors
- Scientists have to design an experiment to answer a question or investigate something
- These will involve?dependent?and?independent?variables
- An independent variable is what is?changed
- A dependent variable is what is?measured
- The?control variables?are what do?not change
- For example, in an investigation of the variation of potential difference and current across a light bulb
- The?independent variable?is the?potential difference
- The?dependent variable?is the?current
- The control variable would be the?temperature?of the apparatus
- Data must always be presented in a scientific way
- This may include:
- Tables
- Graphs
- Diagrams
Presenting Data in Tables
- When taking readings, a sensible range should be taken, and the values should all be stated to an appropriate number of significant figures or decimal places
- This is usually the same number as the?resolution?of the measuring instrument
- The columns in any table should have both a?quantity?and a?unit?in their heading
- When labelling columns, the names of the quantities should be separated from their unit by a forward slash ( / )
- For data displayed in a table:
- The first column should contain the?independent variable
- The second column should contain the?dependent variable
- If repeat readings of the dependent variable are required, these should be included with a column for the mean value at the end
- Any columns required for processing data e.g. calculations should come after this
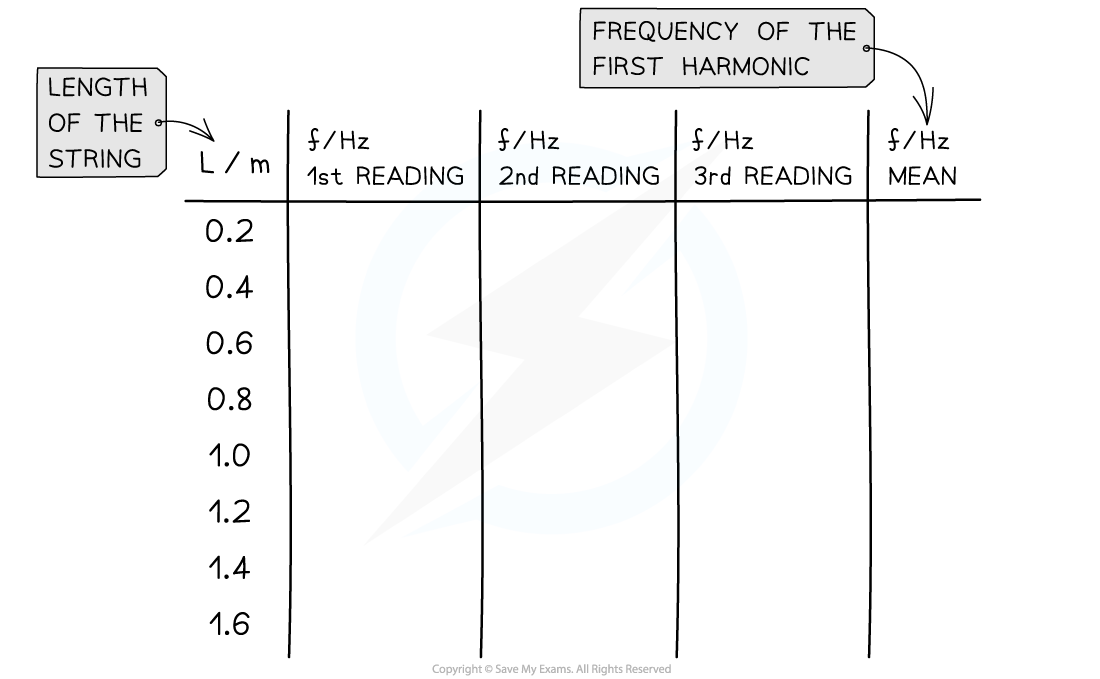
Conventions for presenting data in a table. The length is the independent variable and the frequency is the dependent variable
- In summary, when presenting tables the following must be included:
- Clear headings, or symbols, for columns
- Relevant units for measurements
- Readings listed to the same number of significant figures
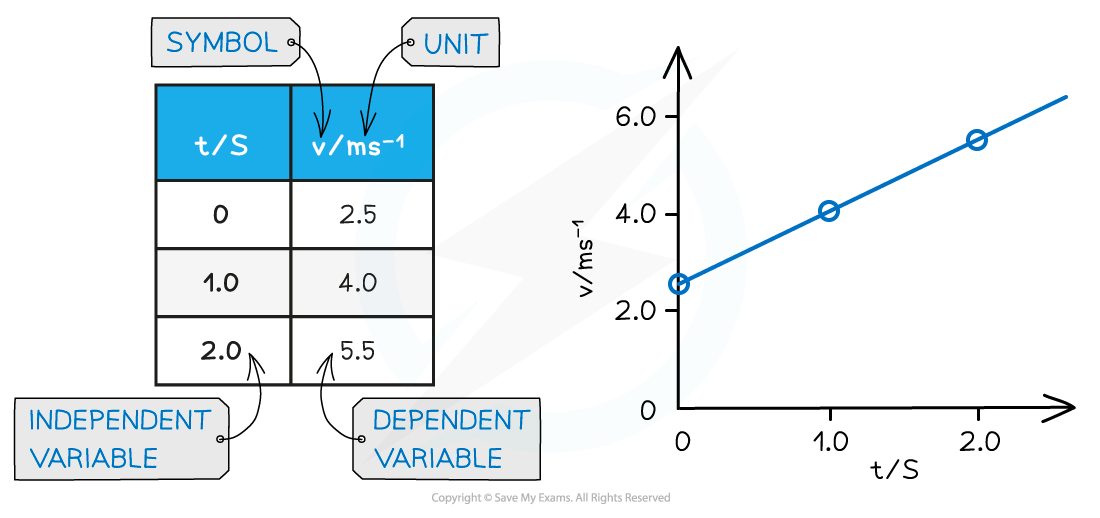
An example of a correctly labelled table with corresponding graph
Presenting Data on a Graph
- All readings, including suspected?anomalous results, should be plotted on a graph so that they can be easily identified
- When taking repeat readings, it is the?mean?value that is plotted
- The way data is presented on a graph depends on what type of data it is
Discrete data
- Only certain values can be taken, normally a whole number e.g. number of students
- This should be displayed on a?scatter graph?or?bar chart
Continuous data
- Can take any value on a scale e.g. voltage in a circuit
- This should be displayed on a?line?or?scatter graph
Categorical data
- Values that can be sorted into categories e.g. types of material
- This should be displayed on a?pie?or?bar chart
Ordered data
- Data that can be put in ordered categories e.g. low, medium, high
- This should be displayed on a?bar chart
- In summary, when presenting graphs the following must be included:
- An explanatory title
- Clearly labeled axes
- Relevant units for measurements
- Well plotted points
- A smooth line or curve of best fit
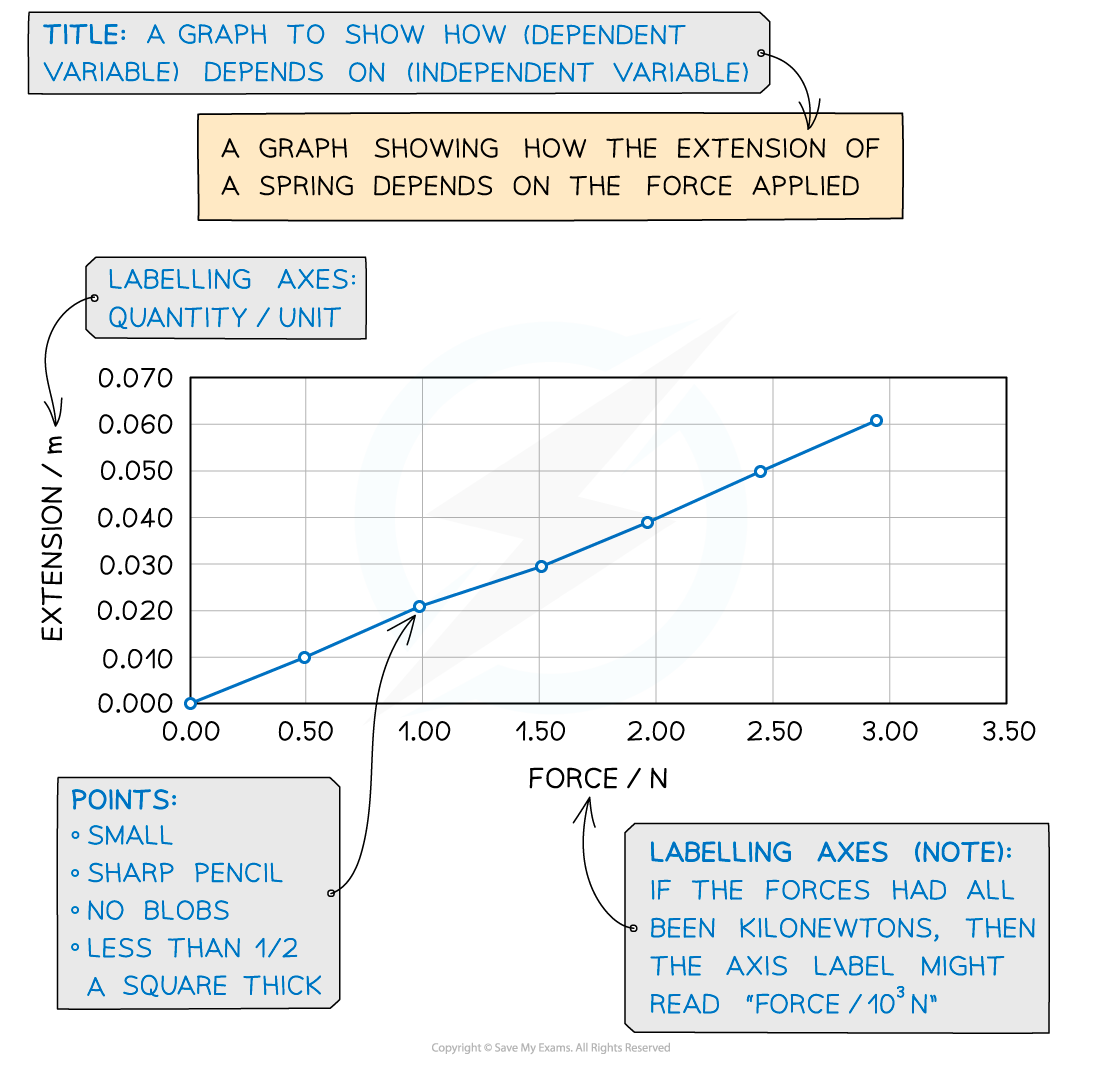
An example of a correctly labelled and plotted graph
Presenting Diagrams
- When presenting diagrams, such as apparatus set-up, all the relevant parts must be clearly labelled
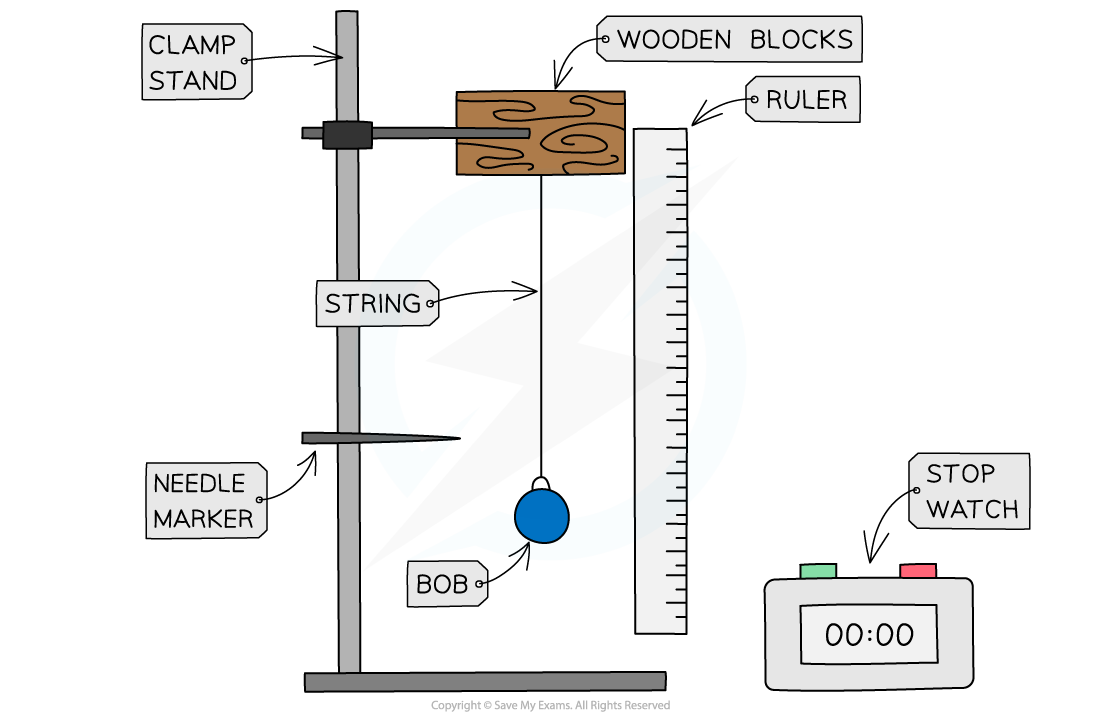
An appropriately labeled diagram of the set-up of an investigation into simple harmonic motion
轉載自savemyexams
以上就是關于【Edexcel A Level Physics:復習筆記1.5 Scientific Communication】的解答,如需了解學校/賽事/課程動態,可至翰林教育官網獲取更多信息。
往期文章閱讀推薦:
翰林獨家 | 經濟學競賽核心精講,一冊打通NEC/IEO/USAEBO!
2026 ALEVEL 夏考A率出爐!愛德思vs牛津AQA,哪些科目真的“好出分”?


翰林AMC8視頻課重磅上線!

國際競賽真題資源免費領取






