- During a titration, a pH meter can be used and a pH curve plotted
- A pH curve is a graph showing how the pH of a solution changes as the acid (or base) is added
IB DP Chemistry: HL復(fù)習(xí)筆記18.1.2 pH Curves

pH Curves
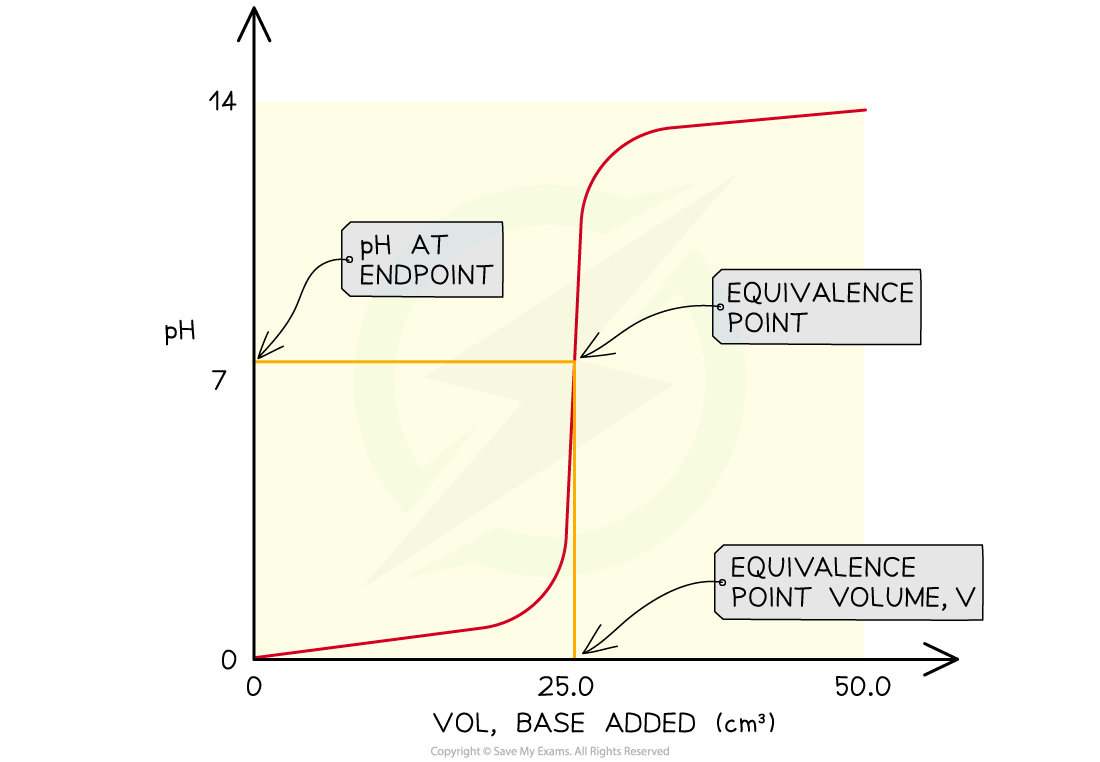
The features of a pH curve
- All pH curves show an s-shape curve
- pH curves yield useful information about how the acid and alkali react together with stoichiometric information
- The midpoint of the inflection is called the?equivalence?or?stoichiometric point
- From the curves you can:
- Determine the pH of the acid by looking where the curve starts on the y-axis
- Find the pH at the equivalence point
- Find volume of base at the equivalence point
- Obtain the range of pH at the vertical section of the curve
Four Types of Acid-Base Titrations
- There are four combinations of acids and alkalis that you should know about:
- strong acid + strong base
- weak acid + strong base
- weak base + strong acid
- weak acid + weak base
Strong Acid + Strong Base
- In this example, sodium hydroxide, NaOH (aq), is being added to hydrochloric acid, HCl (aq)
HCl (aq) + NaOH (aq) → NaCl (aq) + H2O (l)
- The pH intercept on the y axis starts at a low pH, roughly 1, due to the relative strength of the hydrochloric acid
- As the NaOH (aq) is added, there is a gradual rise in pH until the titration approaches the equivalence point
- In this case, the pH at equivalence is 7
- The equivalence point is in the middle of the vertical section of the pH curve
- Once all of the acid has been neutralised, the curve flattens out and continues to rise gradually
- At the end of the titration, the pH will be high due to the relative strength of the sodium hydroxide
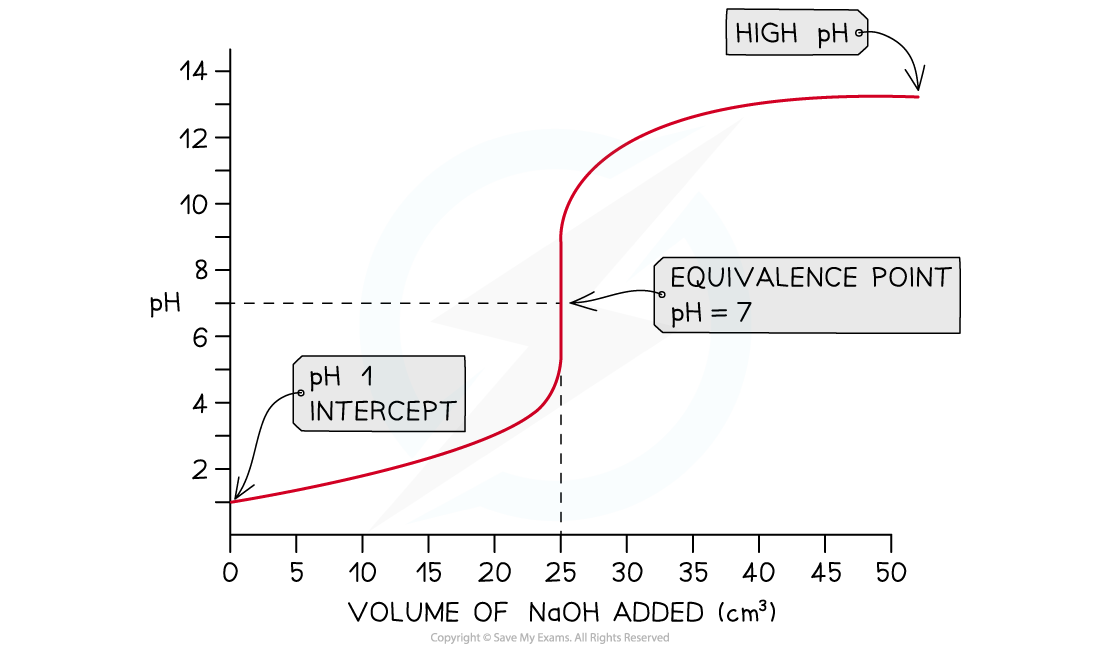
Strong acid - strong base pH curve?
Weak Acid + Strong Base
- In this example, strong sodium hydroxide, NaOH (aq), is being added to weak ethanoic acid, CH3COOH (aq)
NaOH (aq) + CH3COOH (aq) →?CH3COONa (aq) + H2O (l)
- The pH on the intercept on the y axis starts at roughly 3 due to the relative strength of the ethanoic acid
- The initial rise in pH is steep as the neutralisation of the weak acid by the strong base is rapid
- Ethanoate ions (conjugate base to ethanoic acid) are formed which then creates a?buffer
- A buffer consists of a weak acid and its conjugate base or a weak base and its conjugate acid
- At this point, the buffer formed will resist changes in pH so the pH rises gradually as shown in the?buffer region
- The?half equivalence point?is the stage of the titration at which exactly half the amount of weak acid has been neutralised
- [CH3COOH (aq)] = [CH3COO-?(aq)]
- At this point, it is important to note that the pKa?of the acid is equal to the pH
- pKa?= pH?at?half equivalence?
- The equivalence point in a weak acid - strong base titration is?above 7
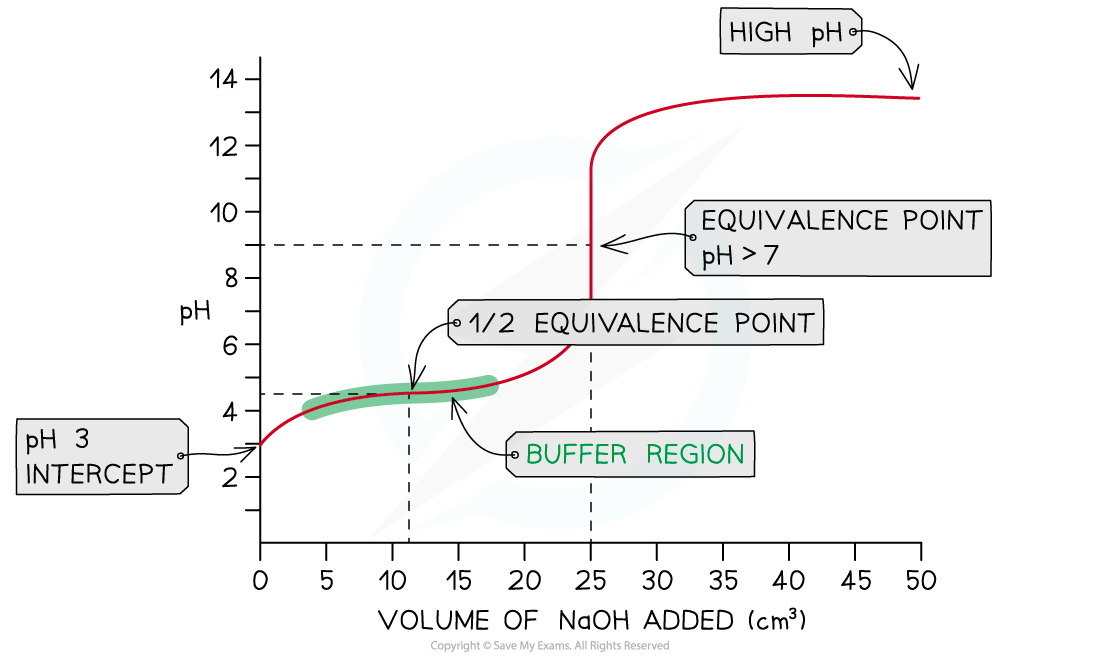
Weak acid - strong base pH curve?
Weak Base + Strong Acid
- In this example, strong hydrochloric acid, HCl (aq), is being added to weak ammonia, NH3?(aq)
NH3?(aq) + HCl (aq) → NH4Cl (aq)
- The pH on the intercept on the y axis starts at roughly 11 due to the relative strength of the ammonia
- The pH will fall as the ammonia begins to be neutralised and the conjugate acid, NH4+?(aq), is produced
- This again creates a buffer region so the pH will only fall gradually
- The?half equivalence point?is the stage of the titration at which exactly half the amount of weak base has been neutralised
- [NH3?(aq)] = [NH4+?(aq)]
- At this point it is important to note that the pKb?of the base is equal to the pOH
- pKb?= pOH?at?half equivalence?
- The pH at equivalence for a weak base-strong acid is?below?7
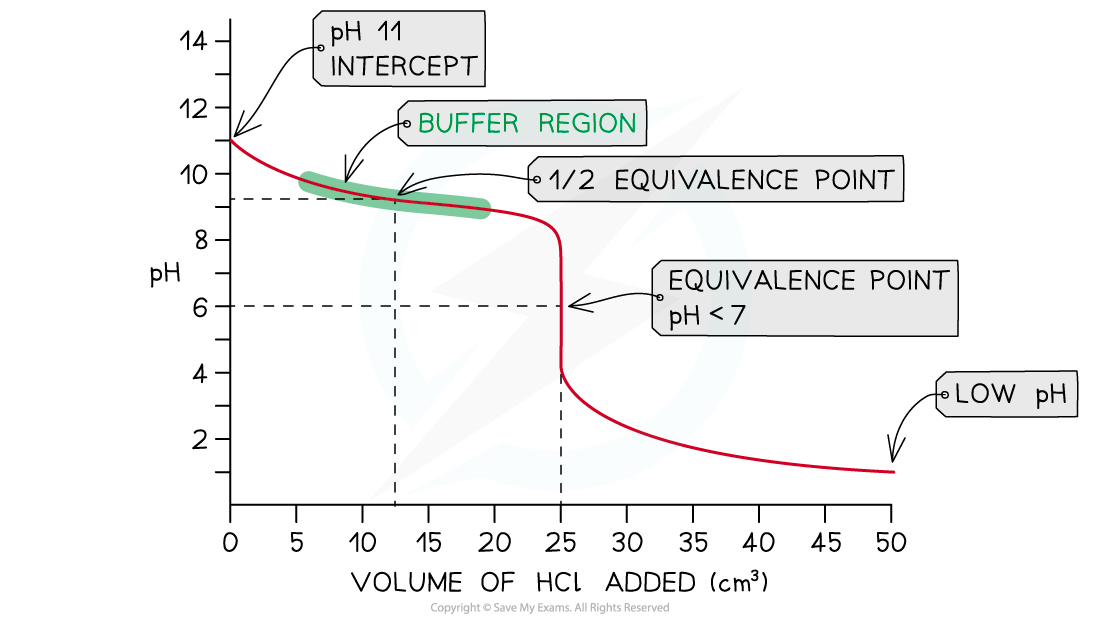
Weak base - strong acid pH curve?
Weak Acid + Weak Base
- In this example, weak ethanoic acid, CH3COOH (aq), is being added to weak ammonia, NH3?(aq)
NH3?(aq) + CH3COOH (aq)→ CH3COONH4?(aq)
- The starting pH of roughly 11 for the weak base will fall as it begins to neutralise
- The change in pH for this titration is very gradual
- Note the that the vertical section of this pH curve is not steep as with other three so the equivalence point is difficult to determine
- Therefore this titration is not performed
- The pH at equivalence for a weak acid -weak base is?roughly 7 but is difficult to determine
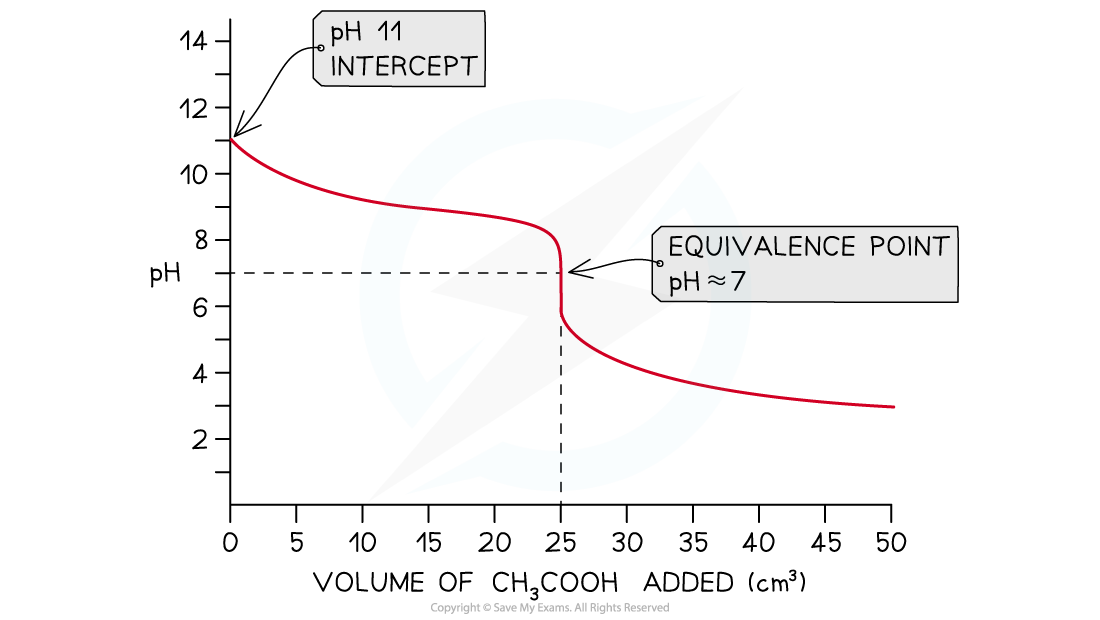
Weak acid - weak base pH curve?
轉(zhuǎn)載自savemyexams
以上就是關(guān)于【IB DP Chemistry: HL復(fù)習(xí)筆記18.1.2 pH Curves】的解答,如需了解學(xué)校/賽事/課程動(dòng)態(tài),可至翰林教育官網(wǎng)獲取更多信息。
往期文章閱讀推薦:
翰林獨(dú)家 | 經(jīng)濟(jì)學(xué)競(jìng)賽核心精講,一冊(cè)打通NEC/IEO/USAEBO!
2026 AMC10/12美國(guó)數(shù)學(xué)競(jìng)賽新賽季!【翰林教育 × 清華大學(xué)出版社】獨(dú)家教材全面發(fā)售!


翰林AMC8視頻課重磅上線!

國(guó)際競(jìng)賽真題資源免費(fèi)領(lǐng)取






