IB DP Chemistry: HL復習筆記6.1.5 Rate Experiments

Rate Experiments
- During a reaction, the?reactants?are used up and changed into the?products
- This means that as the reaction proceeds, the concentration of the reactants is?decreasing?and the concentration of the products is?increasing
- Because of this, the?rate of the reaction?is not the same throughout the reaction but?changes
- The rate of reaction during the reaction can be calculated from a?concentration-time graph.
- The?isomerisation of cyclopropane to propene will be taken as an example:
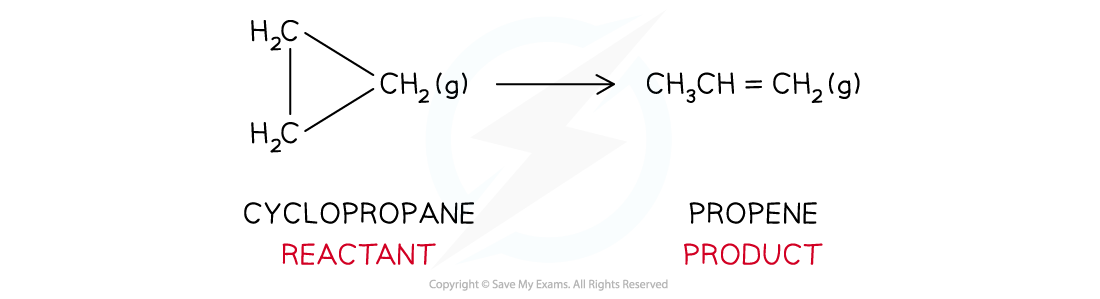
Isomerisation of cyclopropane
- The concentrations of reactant (cyclopropane) and product (propene) over time can be experimentally obtained
Concentrations of Cyclopropane & Propene Table
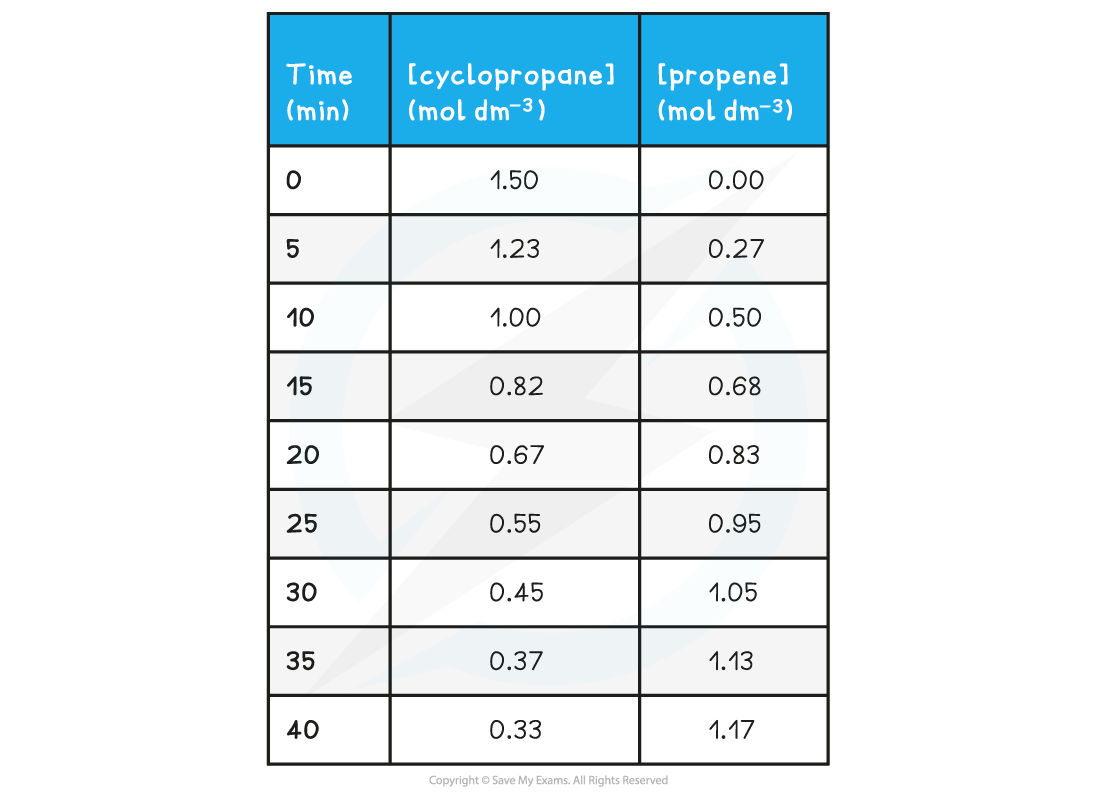
- When taking the measurements, the?temperature?should be kept the same at all times as a?change?in temperature will change the?rate of reaction
- A?concentration-time graph?for the?concentration of propene as well as cyclopropane?can be obtained from the above results
- As an example, the concentration-time graph for propene is shown below:
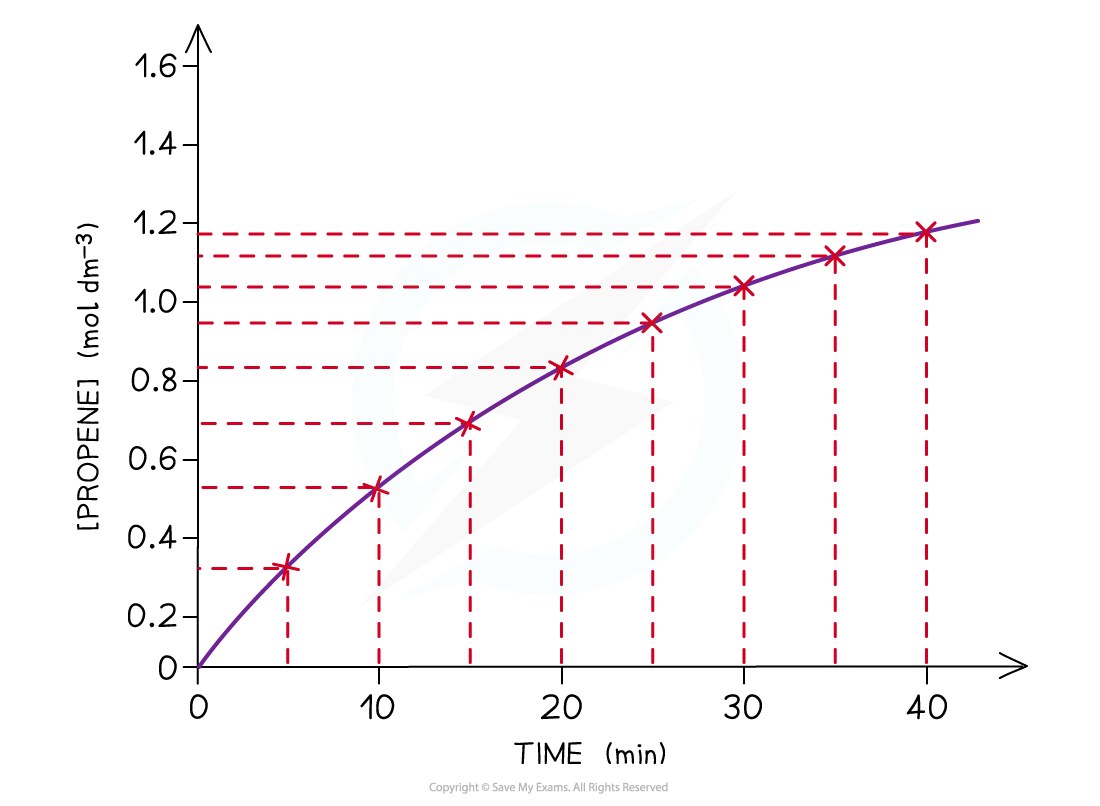
The graph shows that the concentration of propene increases with time
Calculating the rate at the start of a reaction
- At the start of the reaction, the concentration-time curve looks almost linear
- The rate at this point can therefore be found by treating the curve as a linear line and by using:

- Using the graph, the average rate of the reaction over the first 5 minutes for propene is:

Line a shows the average rate over the first five minutes whereas line b shows the actual initial rate found by drawing a tangent at the start of the curve. The calculated rates are very similar for both methods

= 0.0009 mol dm-3?s-1
Calculating the rate as the reaction proceeds
- The curve becomes shallower with time which means that the rate decreases with time
- The rate of reaction can be calculated by taking short time intervals
- Eg. you can calculate the rate of reaction from 15 to 20 mins during which the concentration of propene increases from 0.68 to 0.83 mol dm-3:


= 0.0005 mol dm-3?s-1
- The smaller the time intervals, the more accurate the reaction rate value is
- Even more accurate is to find the rate of reaction at?different concentrations?of reactant or product at?particular time?points
- This can be done by drawing?tangents?at several points on the graph
- As an example, the rates of reaction at different concentrations of cyclopropane are calculated by drawing the appropriate tangents:
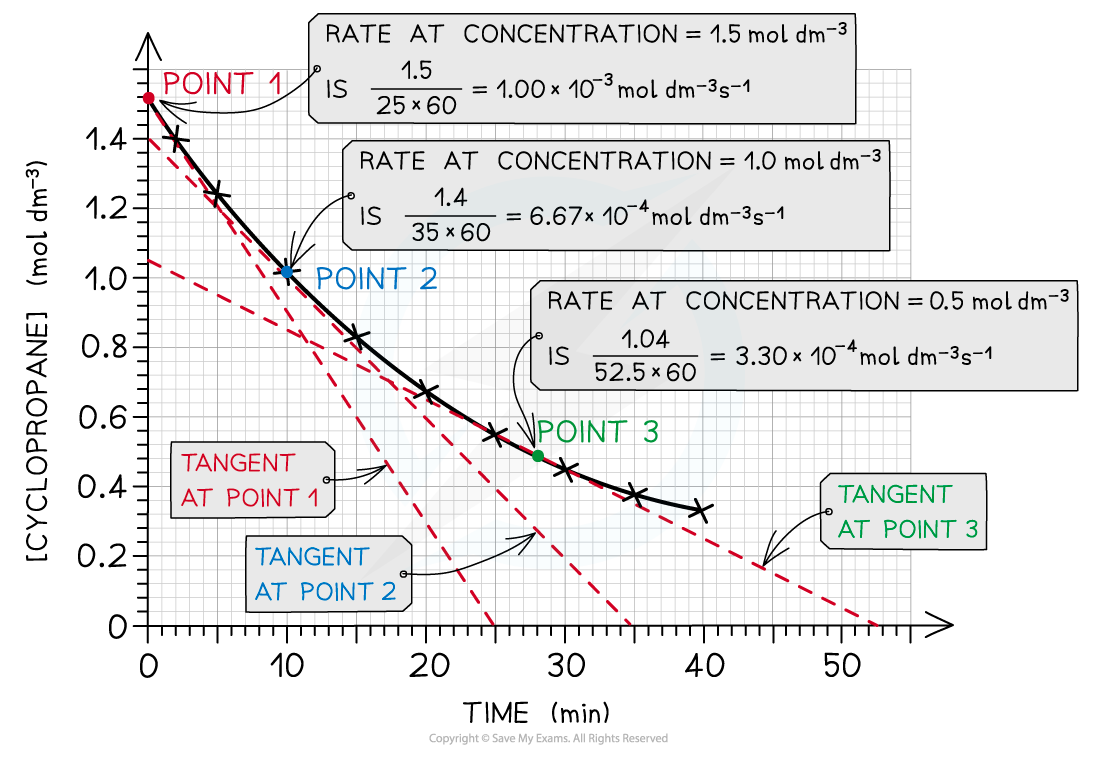
The rate of reaction at 3 different concentrations of cyclopropane is calculated by drawing tangents at those points in the graph
Rate-concentration graph
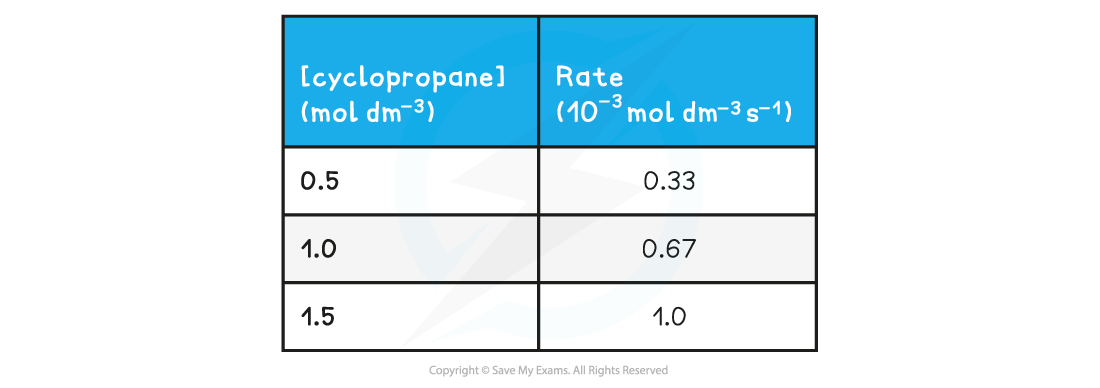
- The calculated rates can then be summarised in a table to show how the rate of reaction changes with changing concentration of the reactants or products
Change in Rate with Decreasing Concentration of Cyclopropane Table
- This data can then be used to plot a rate-concentration graph
- The graph shows that the rate is directly proportional to the concentration of cyclopropane
- If you double the concentration of cyclopropane the rate of reaction will double too
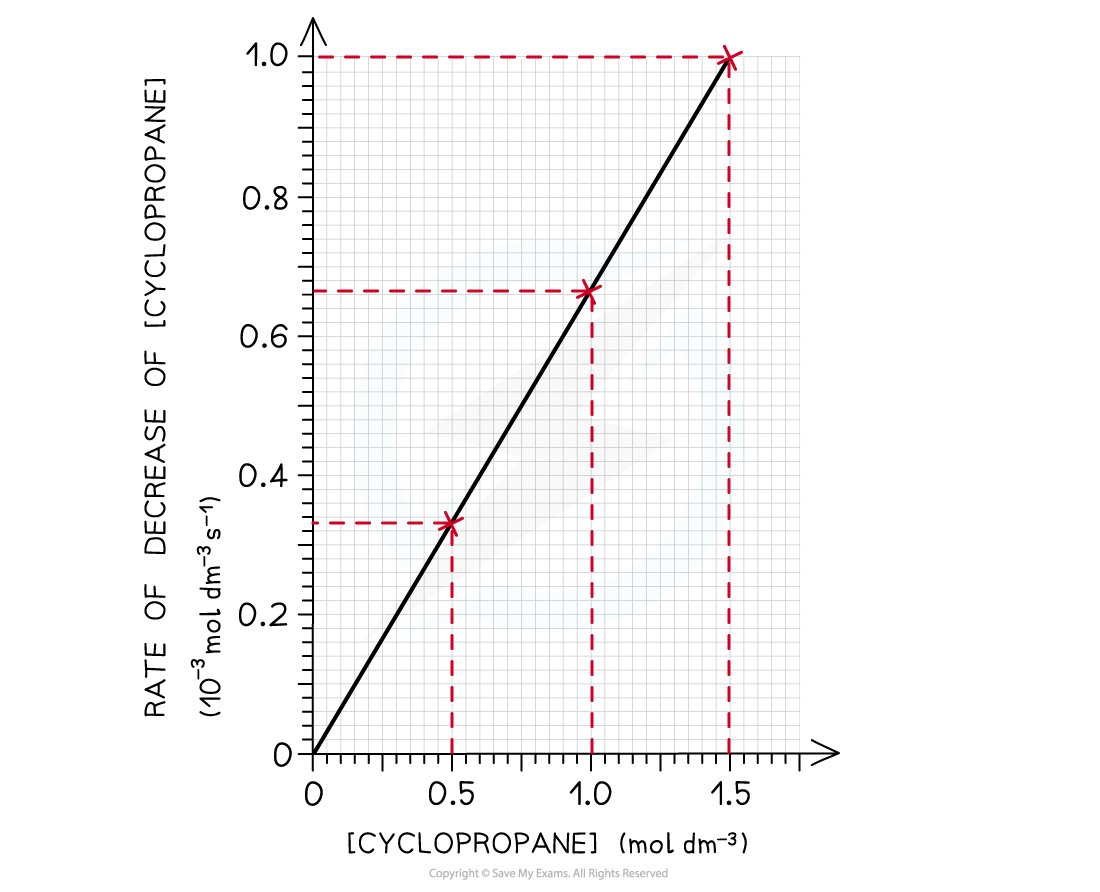
The graph shows a directly proportional correlation between the concentration of cyclopropane and the rate of reaction
Exam Tip
To calculate the rate of reaction you can either use the increase in concentration of products (like in the example above) or the decrease in concentration of reactants.
轉載自savemyexams
以上就是關于【IB DP Chemistry: HL復習筆記6.1.5 Rate Experiments】的解答,如需了解學校/賽事/課程動態,可至翰林教育官網獲取更多信息。
往期文章閱讀推薦:
MIT官方發布【2026年夏季推薦閱讀書單】!橫跨科學/人文/經濟...
IBO官宣!M26 IB放榜全球均分30.88!香港誕生66名狀元,內地均分35.47全球領跑!


翰林AMC8視頻課重磅上線!

國際競賽真題資源免費領取


