IB DP Biology: HL復(fù)習(xí)筆記4.1.8 Skills: Chi-squared test & Statistical Significance

Chi-squared Test for Association
Looking for associations between species
- The distribution of species in a habitat is?rarely random; it usually depends on factors such as soil type, water availability, and competition
- It is sometimes possible to observe an?association?between the distributions of different species within a habitat, e.g.
- Species that are in a?symbiotic?relationship are likely to be?found next to each other; we would say that there is?a positive association between the distributions of these two species
- Species that are in?direct competition?for the same resources will exclude each other from their immediate surroundings, and so are likely to be?found in different parts of a habitat; there might be a?negative association between the distributions of these two species
- If species have?no interaction?with each other, then there will be?no association between their distributions, and any that appears to occur will be?due to chance
- We would say that such species have distributions that are?independent?of each other
- Random sampling?with?quadrats, along with a statistical test called the?chi-squared test,?can be used to test for an?association between two species
Using quadrats to study the distribution of species
- A?quadrat?is a?square frame?that is placed within the area to be studied to provide a?sample
- Quadrats are used to study the?distribution?of?sessile?organisms
- Quadrats can be?different sizes?depending on the species being studied
- A 1 m2 quadrat can be used to study small organisms such as herbaceous plants in a grassland or limpets on a rocky shore
- A 400 m2 quadrat can be used to study large organisms such as trees (quadrats like this will usually be marked out with string rather than a frame!)
- Scientists can record?different types of data?from a quadrat depending on the aim of a study and the species involved
- Presence or absence?of a species
- Species frequency; how many individuals are in the quadrat
- Species abundance; measured on a scale called the?ACFOR?scale on which species are recorded as being abundant, common, frequent, occasional, rare, or none
- Percentage cover; the percentage of the quadrat covered by a species
- Quadrats can be divided up into smaller squares to allow percentage cover to be assessed more easily
- The use of quadrats enables researchers to obtain data that is a?representative sample?for the habitat being studied
- Often an area being studied is very large and it is impractical to record data across an entire habitat, so quadrats provide small?samples?that?represent?the whole habitat
- For a sample to be representative, it needs to be:
- Large enough; the larger and more diverse a habitat, the more quadrats need to be used
- Random; this avoids?bias?e.g. when a student decides to place their quadrats in a particular place because it looks more interesting
- Randomness can be achieved by dividing a habitat up into?grid squares?and then using a?random number generator to decide where to place each quadrat

Random sampling with quadrats can be used to study the distribution of organisms
The chi-squared test
- A statistical test called the?chi-squared test?determines whether there is a?significant difference?between the?observed and expected results?in an experiment
- Its purpose is to assess whether any difference in these results is?due to chance, or?due to an association?between the variables being tested
- A chi-squared test can be used to analyse data from quadrat sampling to determine whether or not there is a?statistically significant association?between the distributions of two species
- To the eye there may appear to be an association between the two species, but if it is?not statistically significant?then researchers can conclude that species distributions are independent of each other, and any appearance of association is?due to chance
- If an association?is statistically significant?then it must be due to?an important factor, such as a symbiotic relationship
- A chi-squared test enables scientists to test hypotheses
- A?hypothesis?is a?testable statement?about the expected outcome of an experiment
- There are two types of hypothesis:
- A?null hypothesis?states that there is?no significant difference, or association,?between data sets e.g. that there is no association between the distributions of two species
- An?alternative hypothesis?states that there is?a significant difference, or association, between data sets e.g. that there is an association (either positive or negative) between the distributions of two species
- The result of a chi-squared test enables scientists to either?accept?or?reject?a?null hypothesis
Using the chi-squared test to test for association
- Step 1: Construct a?contingency table?for your results
- This allows the number of quadrats that contain one, both, or neither species to be recorded
- Step 2: Calculate the row, column, and overall totals for your contingency table
- Step 3: Calculate the?expected?values (E) for your table
- The results recorded in the contingency table are the?observed values?(O); to calculate the chi-squared value we need to calculate the?expected values?for each data point.
- The expected values are what we would expect to see?if the null hypothesis were correct
- Note that this is the first step towards calculating the?chi-squared value, the equation for which is:
Σ = sum of????????? O = observed value ???????? E = expected value
- Step 4: Calculate the?difference?between the observed and expected values
- Subtract the expected values from the observed values (O - E); some of the resulting values will be negative
- Step 5: Square each difference
-
- This eliminates negative values
-
- Step 6: Divide each squared difference by the expected value
- Step 7: Add all of the results from step 6 together
- This gives the?chi-squared value
- Step 8: Calculate the?degrees of freedom
- Step 9: Establish a?probability?level or?p-value
- As biologists, we work with a probability level of?0.05, or?5%
- This means that we can be 95% certain that any significant difference or association is?not?due to chance
- Some studies require a higher level of certainty than this e.g. medical researchers may use a smaller p-value
- Step 10: Use a?critical values table?and the results of steps 8-9 to find the critical value
- In order to understand what the chi-squared value says about the data, a table relating chi-squared values to probability is needed; this?critical values table?displays the probabilities that the differences between expected and observed values are due to chance
- Step 11: Compare the chi-squared value with the critical value to assess?the significance
Worked Example
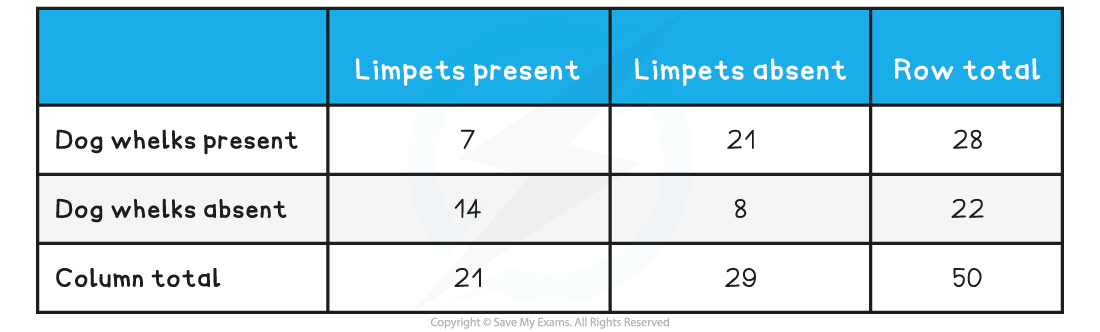
A researcher decided to test for an association between the distribution of two types of mollusc on a rocky shore; limpets and dog whelks. Their?null hypothesis?was that there was no association between the distributions of limpets and dog whelks.They carried out 50 randomly placed quadrat samples on the rocky shore, recording either the presence or the absence of both limpets and dog whelks in each quadrat.They obtained the following results:
- Quadrats containing limpets only: 14
- Quadrats containing dog whelks only: 21
- Quadrats containing both limpets and dog whelks: 7
- Quadrats containing neither limpets nor dog whelks: 8
Use the chi-squared test to determine whether or not there is a?statistically significant association?between the distributions of limpets and dog whelks.
Step 1: Construct a contingency table
Contingency Table?

Step 2: Calculate the row, column, and overall totals for your contingency table
Contingency Table
Step 3: Calculate the expected values
The equation for working out the expected values is:
E.g. to calculate the expected value for the category in which both dog whelks and limpets are present:
 Step 4: Calculate the difference between the observed and expected values
O = 7
E = 11.76
7 - 11.76 = -4.76
Step 5: Square each difference
-4.762 = 22.66
Step 6: Divide each squared difference by the expected value
22.66?÷ 11.76 = 1.93
Repeat steps 3-6 for all of the results in the contingency table
Chi-squared Working Out Table
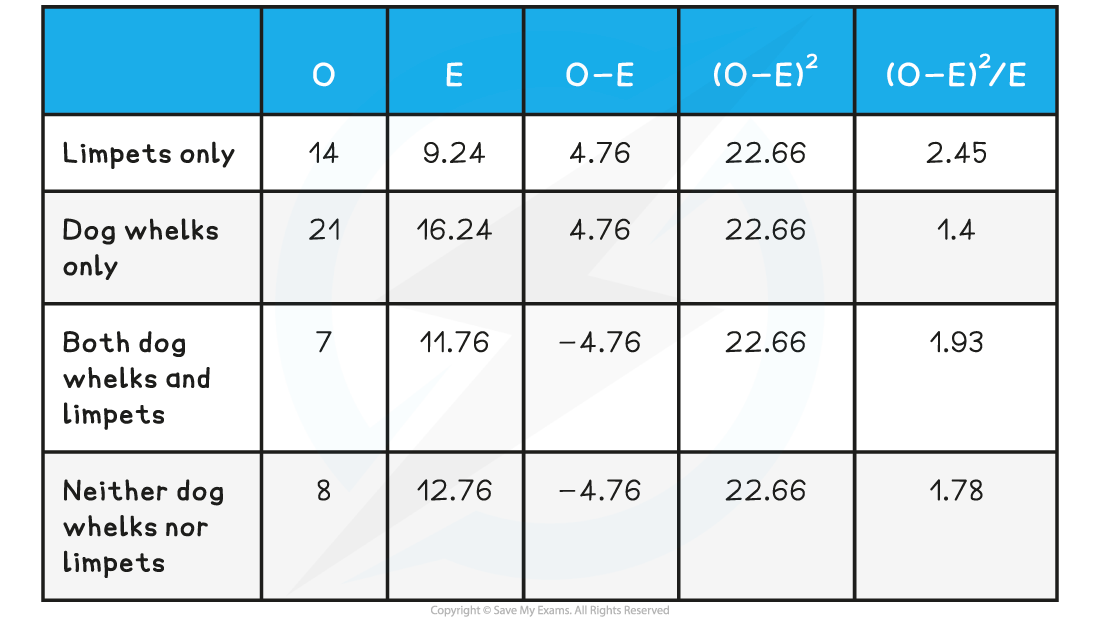
Step 7: Add all of the results from step 6 together to obtain the chi-squared value
2.45 + 1.4 + 1.93 + 1.78 = 7.56 (this is the?chi-squared value)
Step 8: Calculate the degrees of freedom
Degrees of freedom can be calculated using the following equation:
Degrees of freedom = (number of columns - 1) x (number of rows - 1)
Columns and rows refer to the original contingency table.
In this example, there are 2 columns and 2 rows in the contingency table
Degrees of freedom = (2 - 1) x (2 - 1)
= 1 x 1
= 1
Step 9: Determine the probability level
As biologists, we work at a?probability of 0.05,?or?5%
Step 10: Use a critical values table and the results of steps 8-9 to find the critical value
Chi-squared Critical Values Table
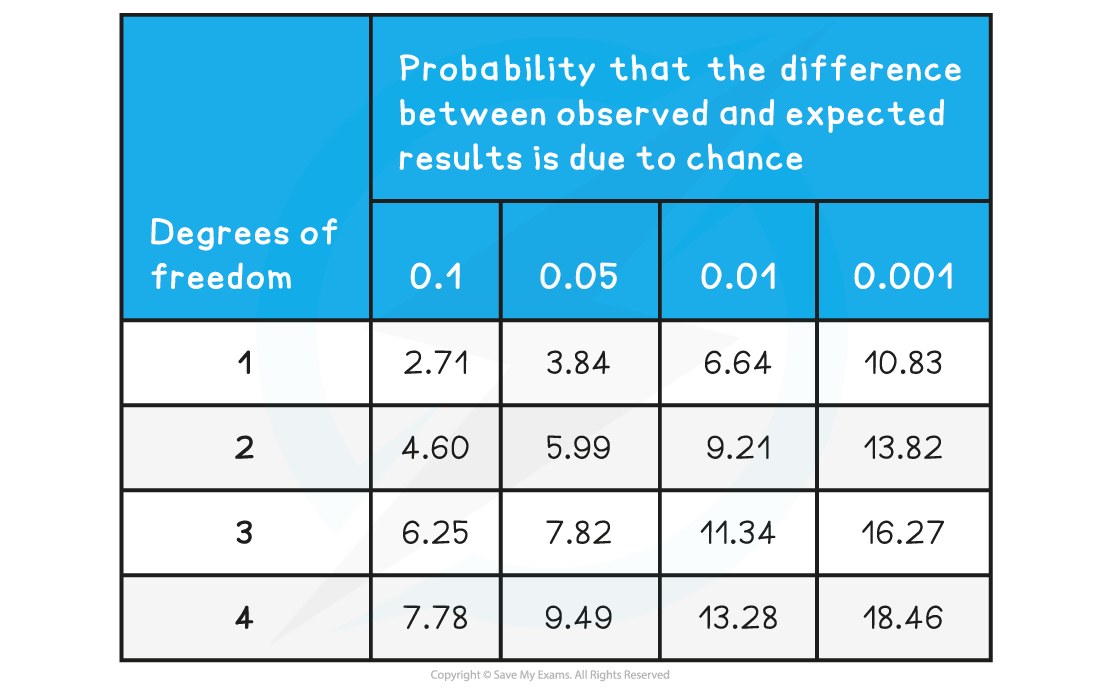
With?degrees of freedom?as?1, and a?probability level?of?0.05, the?critical value?can be read from the table as?3.84
Step 11: Compare the chi-squared value with the critical value to assess significance
The chi-squared value of 7.56?is larger than?the critical value of 3.84
This means that there?is a significant association?between the two species?(see section below on statistical significance)
Exam Tip
When calculating a chi-squared value it is very helpful to create a table like the one seen in the worked example. This will help you with your calculations and make sure you don’t get muddled up!
Statistical Significance
- The?chi-squared value, once calculated, can be compared to a?critical value; this allows?statistical significance?to be?assessed
- If the chi-squared value is?larger?than the critical value, there is a?statistically significant?difference?between observed and expected values, or a?statistically significant?association?between two sets of results
- In this case, the?null hypothesis?can be?rejected
- If the chi-squared value is?equal to or smaller than?the critical value, there is no?statistically significant?difference?between observed and expected values, or no?statistically significant?association?between two sets of results
- ?In this case, the?null hypothesis?can be?accepted
- To determine the critical value biologists generally use a?probability level, or?p-value, of?0.05, or?5%
- This means that if a difference or association is shown to be statistically significant?at this level, there is only a?5% probability (i.e. probability = 0.05) that this result might be due to chance
轉(zhuǎn)載自savemyexams
以上就是關(guān)于【IB DP Biology: HL復(fù)習(xí)筆記4.1.8 Skills: Chi-squared test & Statistical Significance】的解答,如需了解學(xué)校/賽事/課程動態(tài),可至翰林教育官網(wǎng)獲取更多信息。
往期文章閱讀推薦:
MIT官方發(fā)布【2026年夏季推薦閱讀書單】!橫跨科學(xué)/人文/經(jīng)濟(jì)...
IBO官宣!M26 IB放榜全球均分30.88!香港誕生66名狀元,內(nèi)地均分35.47全球領(lǐng)跑!


翰林AMC8視頻課重磅上線!

國際競賽真題資源免費(fèi)領(lǐng)取


