IB DP Maths: AI SL復習筆記4.1.7 Interpreting Data

Interpreting Data
How do I interpret statistical measures?
- The?mode?is useful for?qualitative data
- It is not as useful for quantitative data as there is not always a unique mode
- The?mean includes all values
- It is affected by outliers
- A smaller/larger mean is preferable depending on the scenario
- A smaller mean time for completing a puzzle is better
- A bigger mean score on a test is better
- The?median is not affected by outliers
- It does not use all the values
- The range gives the full spread?of the all of the data
- It is affected by outliers
- The?interquartile range gives the spread of the middle 50%?about the median and is not affected by outliers
- It does not use all the values
- A bigger IQR means the data is more spread out about the median
- A smaller IQR means the data is more centred about the median
- The?standard deviation?and?variance?use all the values to give a measure of the?average spread?of the data about the mean
- They are affected by outliers
- A bigger standard deviation means the data is more spread out about the mean
- A smaller standard deviation means the data is more centred about the mean
How do I choose which diagram to use to represent data?
- Box plots
- Can be used with ungrouped?univariate?data
- Shows the range, interquartile range and quartiles clearly
- Very useful for comparing data patterns quickly
- Cumulative frequency graphs
- Can be used with continuous grouped univariate data
- Shows the running total of the frequencies that fall below the upper bound of each class
- Histograms
- Can be used with continuous grouped univariate data
- Used with equal class intervals
- Shows the frequencies of the group
- Scatter diagrams
- Can be used with ungrouped?bivariate?data
- Shows the graphical relationship between the variables
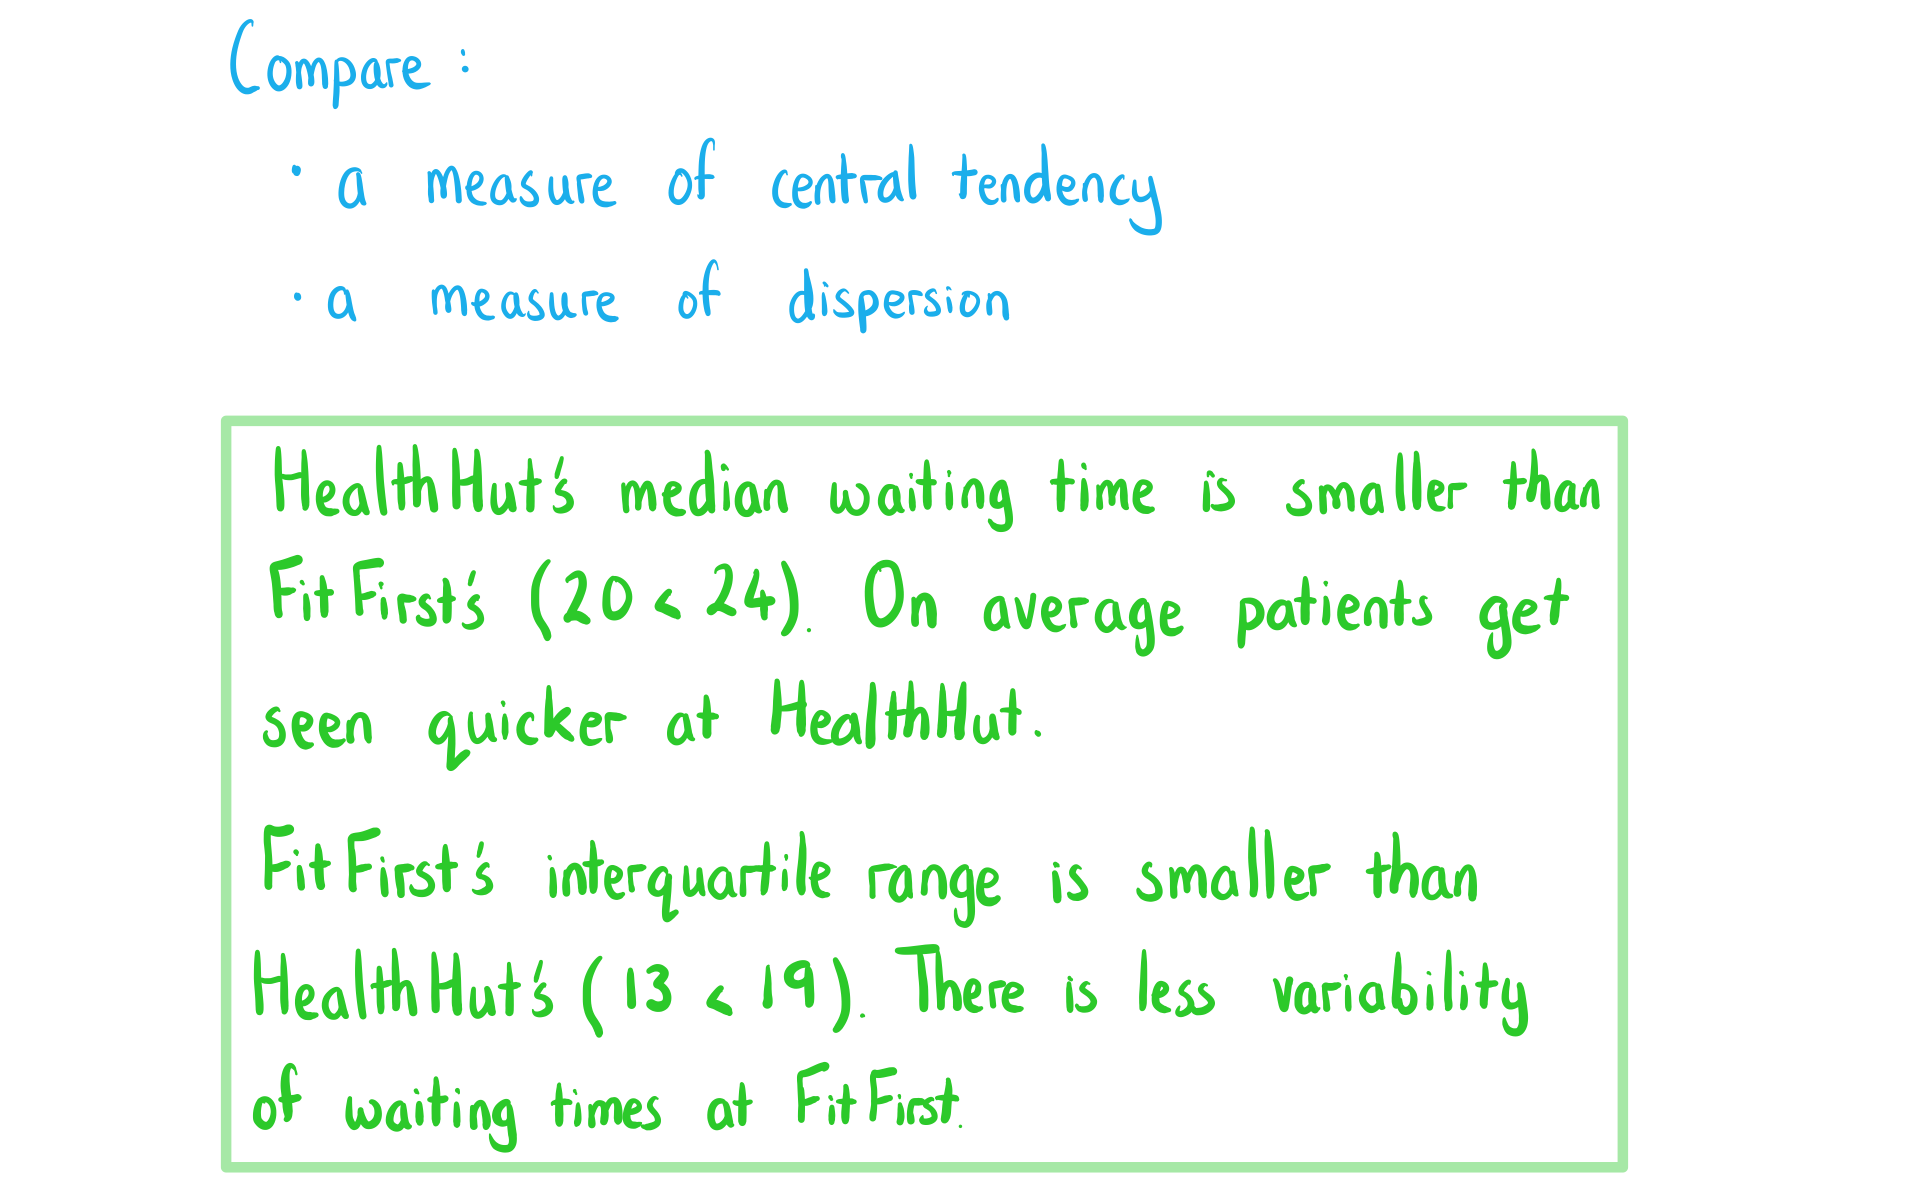
How do I compare two or more data sets?
- Compare a?measure of central tendency
- If the data?contains outliers - use the median
- If the data is?roughly symmetrical – use the mean
- Compare a?measure of dispersion
- If the data?contains outliers - use the interquartile range
- If the data is?roughly symmetrical – use the standard deviation
- Consider whether it is better to have a smaller or bigger average
- This will depend on the context
- A smaller average time for completing a puzzle is better
- A bigger average score on a test is better
- This will depend on the context
- Consider whether it is better to have a smaller or bigger spread
- Usually a smaller spread means it is more consistent
- Always relate the?comparisons to the context?and consider reasons
- Consider the?sampling technique?and the?data collection?method
Worked Example
The box plots below show the waiting times for the two doctor surgeries, HealthHut and FitFirst.
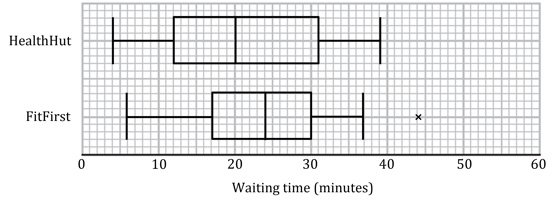
Compare the two distributions of waiting times in context.
轉載自savemyexams
以上就是關于【IB DP Maths: AI SL復習筆記4.1.7 Interpreting Data】的解答,如需了解學校/賽事/課程動態,可至翰林教育官網獲取更多信息。
往期文章閱讀推薦:
IB大考7月6日放榜!查分·復議·補錄·Plan B,一份保姆級Results Day全攻略請收好!
IBO官宣2027年課改:數學、語言、藝術全調整,你的學習計劃要更新了!


翰林AMC8視頻課重磅上線!

國際競賽真題資源免費領取


