IB DP Maths: AA HL復習筆記4.2.2 Correlation & Regression

PMCC
What is Pearson’s product-moment correlation coefficient?
- Pearson’s product-moment correlation coefficient (PMCC) is a way of giving a numerical value to a?linear relationship?of bivariate data
- A?positive value?of?r?describes?positive correlation
- A?negative value?of?r?describes?negative correlation
- r?= 0 means there is?no linear correlation
- r?= 1 means?perfect positive linear?correlation
- r?= -1 means?perfect negative linear?correlation
- The closer to 1 or -1 the stronger the correlation
How do I calculate Pearson’s product-moment correlation coefficient (PMCC)?
- You will be expected to use the statistics mode on your GDC to calculate the PMCC
- The formula can be useful to deepen your understanding
-
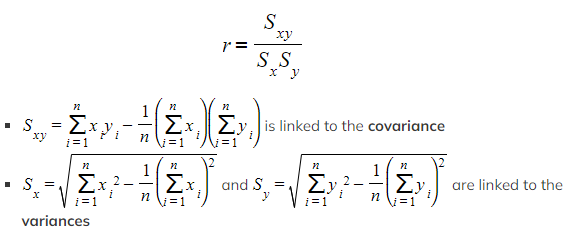 You?do not need to learn this?as using your GDC will be expected
When does the PMCC suggest there is a linear relationship?
- Critical values?of?r?indicate when the PMCC would suggest there is a linear relationship
- In your exam you will be given critical values where appropriate
- Critical values will depend on the size of the sample
- If the?absolute value?of the?PMCC?is?bigger?than the?critical value?then this suggests a linear model is appropriate
Linear Regression
What is linear regression?
- If?strong linear correlation?exists on a scatter diagram then the data can be modelled by a?linear model
- Drawing lines of best fit by eye is not the best method as it can be difficult to judge the best position for the line
- The?least squares regression line?is the line of best fit that minimises the?sum of the squares?of the gap between the line and each data value
- It can be calculated by either looking at:
- vertical distances?between the line and the data values
- This is the?regression line of?y?on?x
- horizontal distances?between the line and the data values
- This is the?regression line of?x?on?y
- vertical distances?between the line and the data values
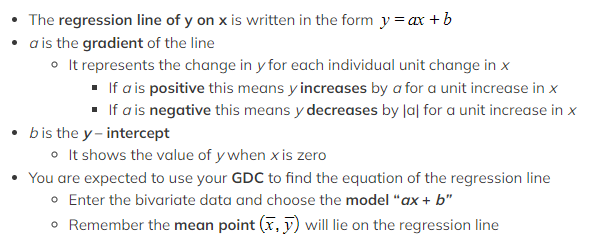
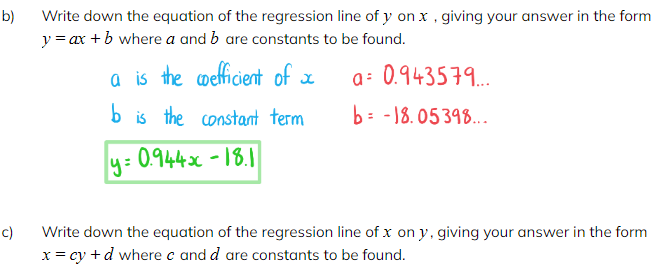
How do I find the regression line of?y?on?x?
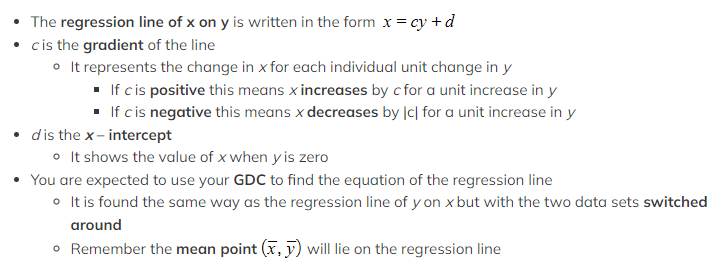
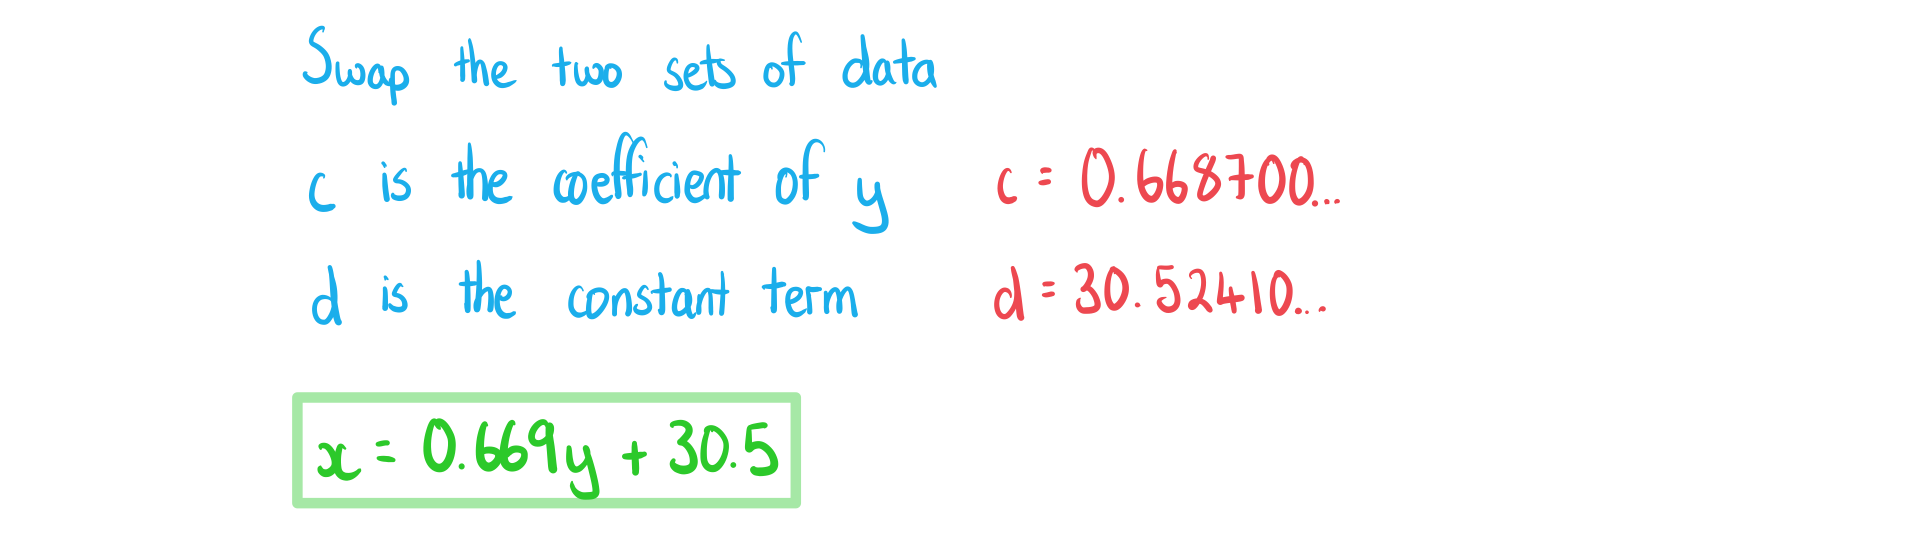
 How do I find the regression line of?x?on?y?
 How do I use a regression line?
- The regression line can be used to decide what type of correlation there is if there is no scatter diagram
- If the gradient is?positive?then the data set has?positive correlation
- If the gradient is?negative?then the data set has?negative correlation
- The regression line can also be used to?predict?the value of a?dependent variable?from an?independent variable
- The equation for the?y?on?x?line should only be used to make predictions for?y
- Using a?y?on?x?line to predict?x?is not always reliable
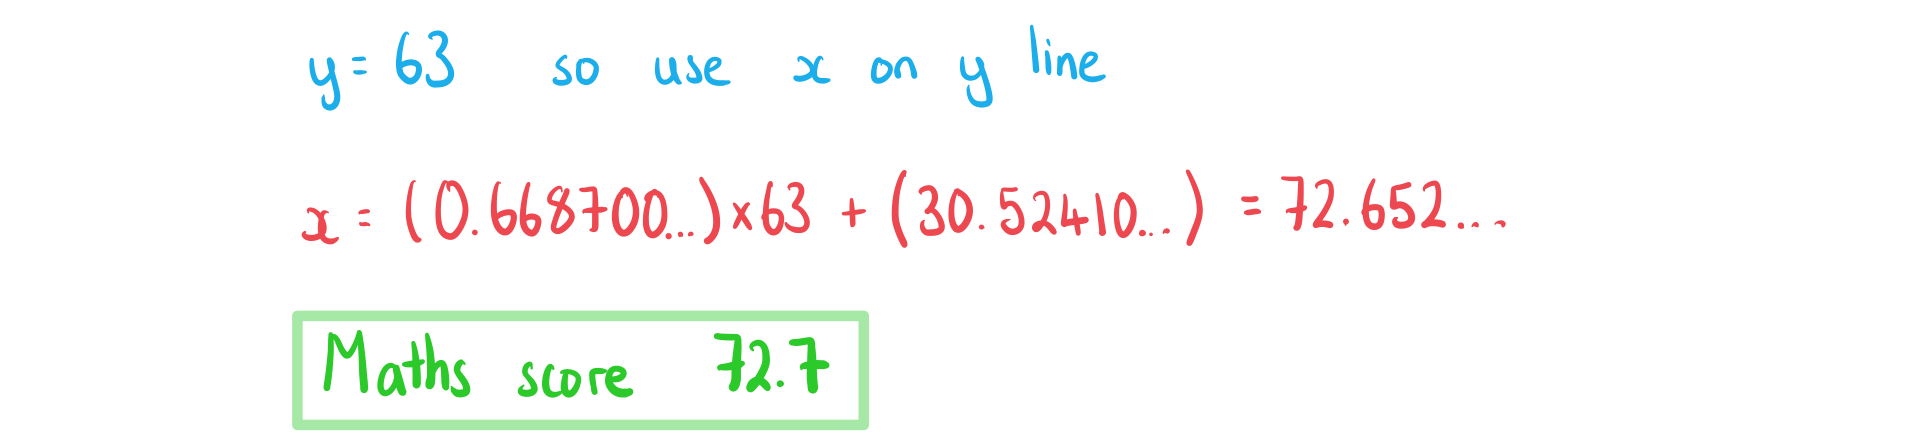
- The equation for the?x?on?y?line should only be used to make predictions for?x
- Using an?x?on?y?line to predict?y?is not always reliable
- Making a prediction within the range of the given data is called?interpolation
- This is usually reliable
- The stronger the correlation the more reliable the prediction
- Making a prediction outside of the range of the given data is called?extrapolation
- This is much less reliable
- The prediction will be more reliable if the number of data values in the original sample set is bigger
- The equation for the?y?on?x?line should only be used to make predictions for?y
 Exam Tip
- Once you calculate the values of?a?and?b?store then in your GDC
- This means you can use the full display values rather than the rounded values when using the linear regression equation to predict values
- This avoids rounding errors
Worked Example
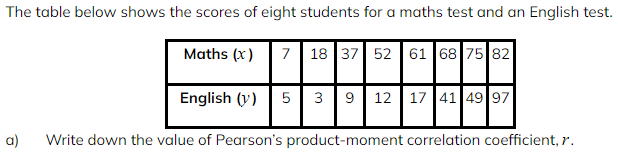
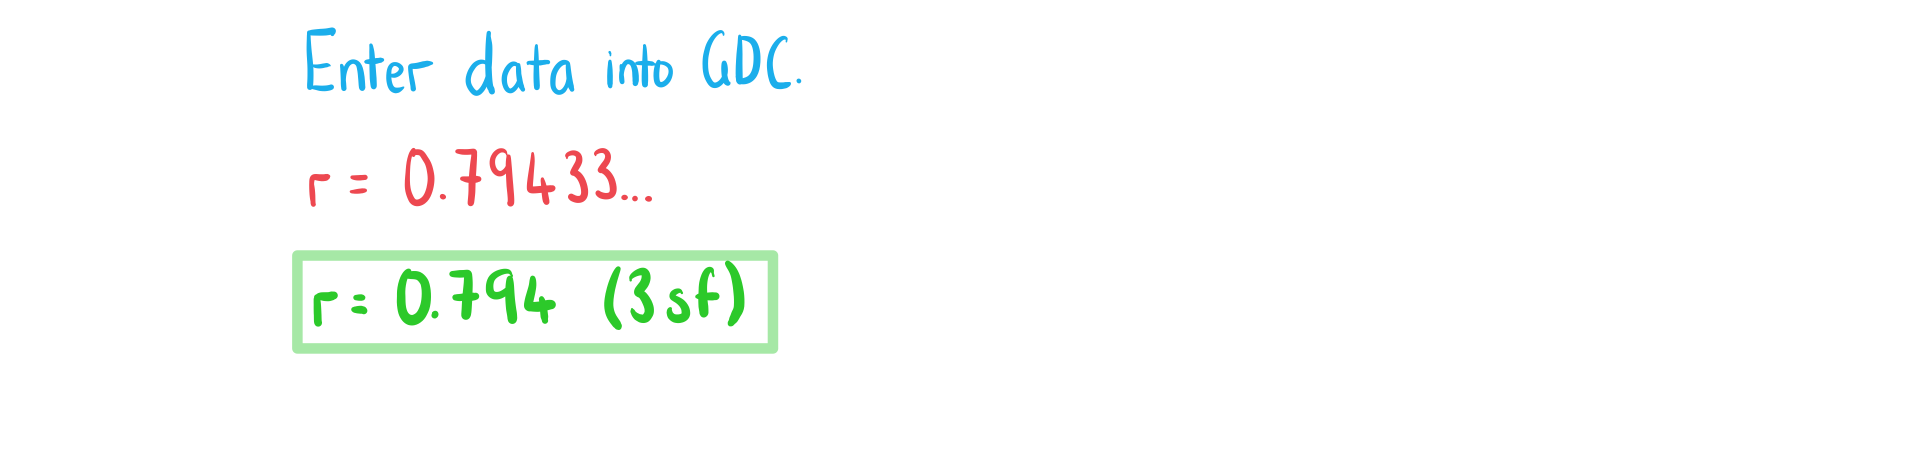
d)? ? ? Use the appropriate regression line to predict the score on the maths test of a student who got a score of 63 on the English test.
轉載自savemyexams
以上就是關于【IB DP Maths: AA HL復習筆記4.2.2 Correlation & Regression】的解答,如需了解學校/賽事/課程動態,可至翰林教育官網獲取更多信息。
往期文章閱讀推薦:
MIT官方發布【2026年夏季推薦閱讀書單】!橫跨科學/人文/經濟...
IBO官宣!M26 IB放榜全球均分30.88!香港誕生66名狀元,內地均分35.47全球領跑!


翰林AMC8視頻課重磅上線!

國際競賽真題資源免費領取


