Edexcel IGCSE Maths 復習筆記 6.1.2 Averages from Tables & Charts

Edexcel IGCSE Maths 復習筆記 6.1.2 Averages from Tables & Charts
How do we find averages if there are lots of values?
- In reality there will be far more data to work with than just a few numbers
- In these cases the data is usually organised in such a way to make it easier to follow and understand – for example in a?table?or?chart
- We can still find the?mean,?median?and?mode?but have to ensure we understand what the table or chart is telling us
What do I need to know?
- Finding the median and mode from tables/charts is fairly straightforward once you understand what the table/chart is telling you so these notes focus mainly on finding the mean
1. Finding the mean from (discrete) data presented in tables
- Tables allow data to be summarised neatly – and quite importantly it puts it into order
Eg. the number of pets owned by 40 pupils in year 11 are summarised in the table below:
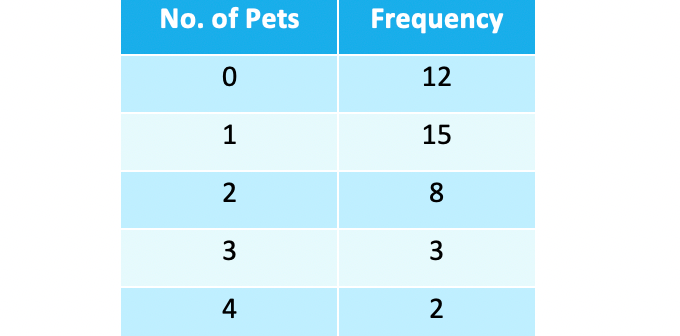
Work out the mean and median number of pets per pupil.
The?mean?can be found as you long as understand what the table is telling you:
It tells you:
12 (of the 40) pupils had no pets; 15 of them had 1 pet; 8 had 2 pets
This means you can add up all the 0’s very quickly, all the 1’s very quickly etc. using multiplication:? 12 x 0 = 0, 15 x 1 = 15, etc.
The easiest way to do this is to add another column to the table and adding a?total row?will prove useful in the next stage too:
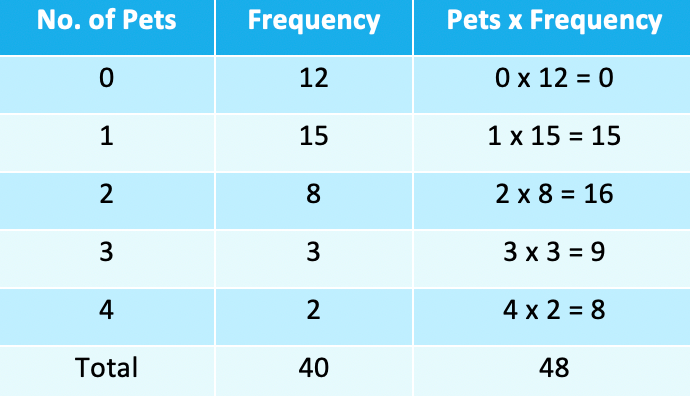
- You can now see that the total number of pets for the whole of the 40 pupils is 48
- If you hadn’t been told in the question, the total of the frequency column would’ve told you how many pupils there are
- You can now find the mean:
48 ÷ 40 = 1.2
The mean number of pets is 1.2 (pets per pupil)
- You may sometimes see the number of pets called x and the frequency f so the last column would be:f x? (f times x)
2. Median
- The?median?is a little complicated to understand but easy to work out
- Remember you are looking for the middle value when the data is in order
- For the example above the table is in order (0, then 1, 2, etc.) – so you need to work out which of the 40 values is in the median position
- To do this you add one to the number of values and divide by 2
(40 + 1) ÷ 2 = 20.5 – so the median is in the “20.5th” position
- The table tells you the first twelve numbers on the list are all 0’s, the next 15 are all 1’s – so the “20.5th” value in the list must be a 1The median number of pets is 1(Note that the “20.5th” value is referring to halfway between the 20th?and 21st?values. Both of these are 1’s so median must be 1 (or use (1 + 1) ÷ 2 = 1 if you’re not convinced!)
3. Mode (modal value)
- The?mode?(or?modal?value) is simple to identify
- Look for the highest frequency – and then you find the corresponding data value
In the example above the highest frequency is 15
Modal number of pets = 1
- Don’t confuse the number of pets with the frequency
Worked Example
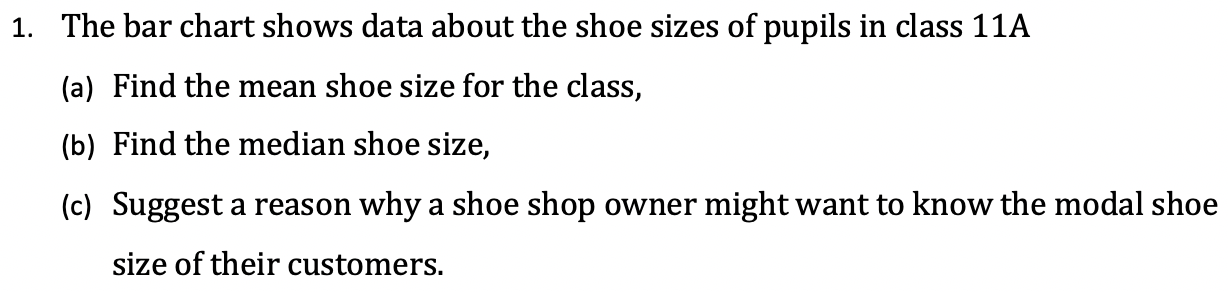
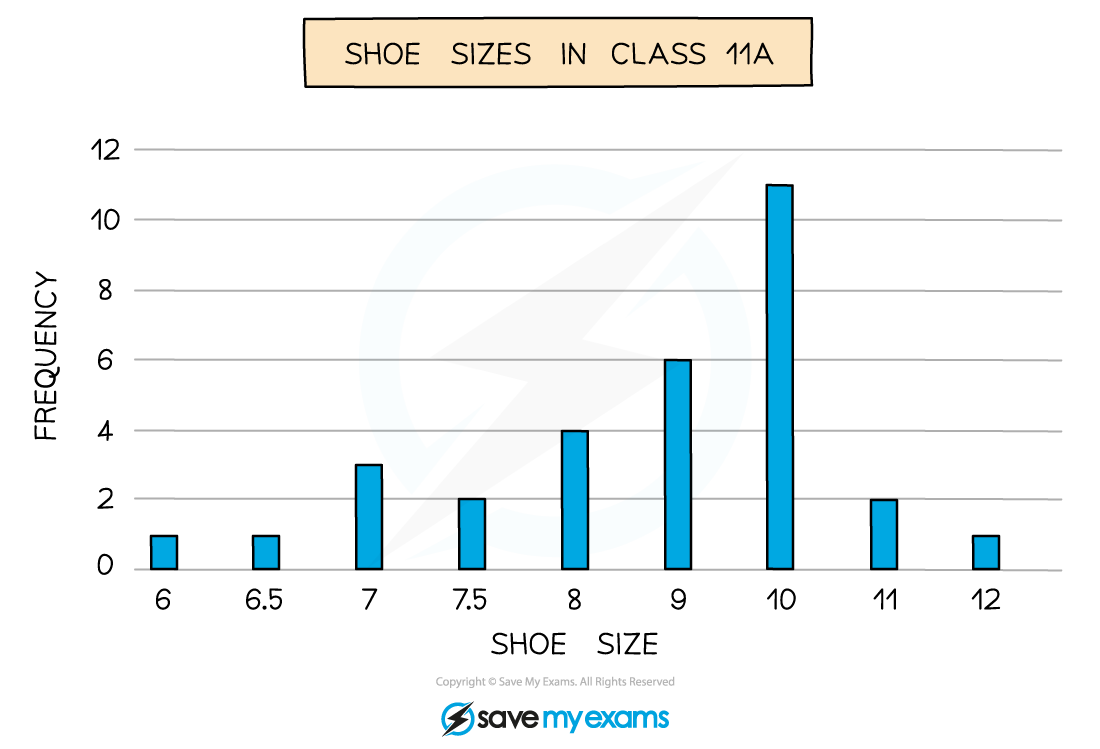
Worked Example
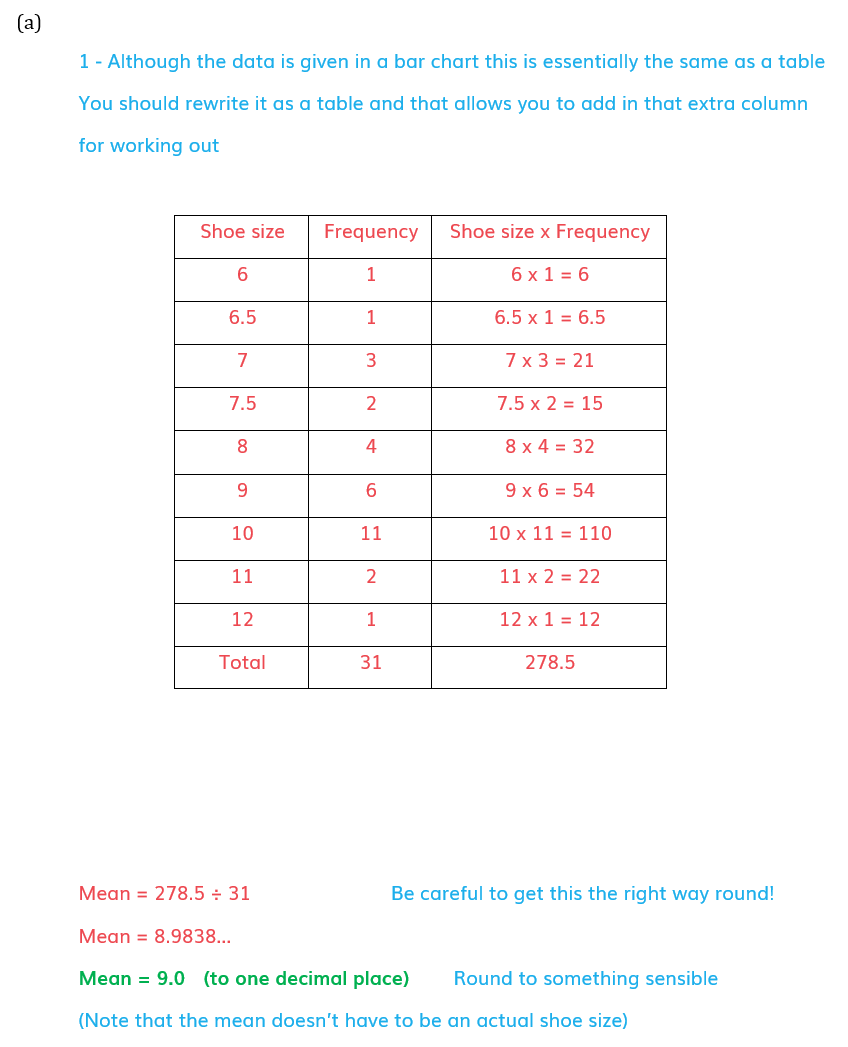
Worked Example
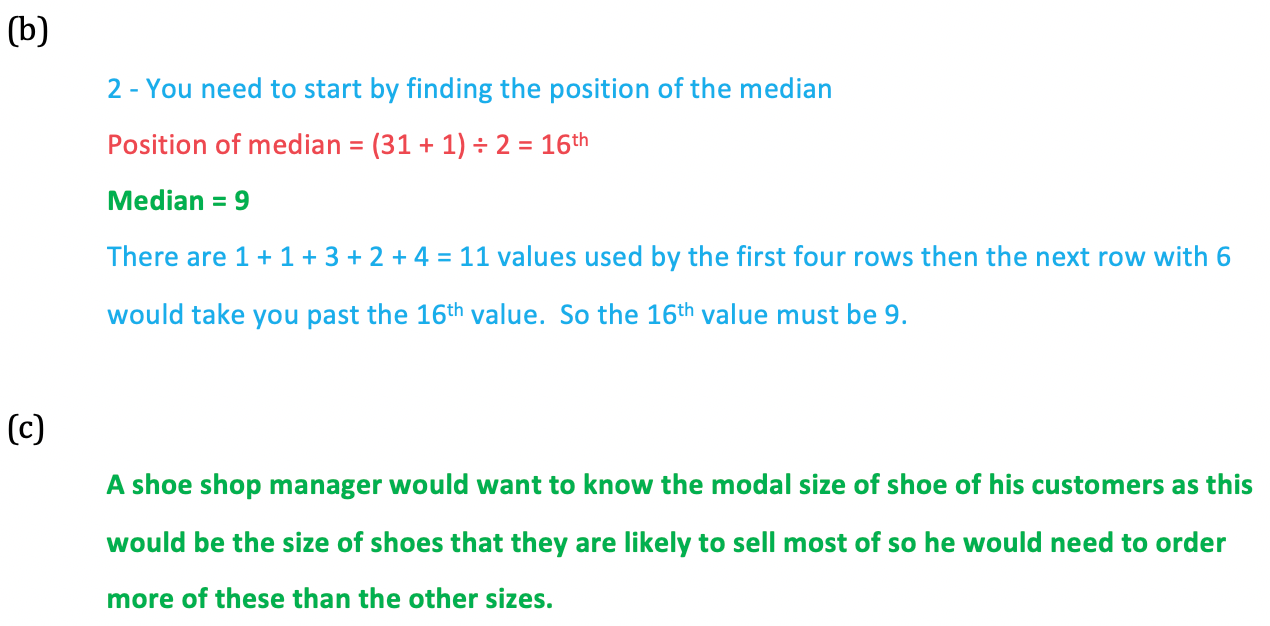
轉載自savemyexam
以上就是關于【Edexcel IGCSE Maths 復習筆記 6.1.2 Averages from Tables & Charts】的解答,如需了解學校/賽事/課程動態,可至翰林教育官網獲取更多信息。
往期文章閱讀推薦:
翰林獨家 | 經濟學競賽核心精講,一冊打通NEC/IEO/USAEBO!
IGCSE全A*,A-Level階段卻崩了?別忽視IGCSE選課的重要性!


翰林AMC8視頻課重磅上線!

國際競賽真題資源免費領取






